The total outgoing traffic of ftp.fau.de increased from 10.06 PiB in 2024 to 10.22 PiB in 2025, a below-noise-level increase of only 1.5%.
| Rank | Mirror | Traffic 2025 in TB | Rank/Traffic 2024 (for comparison) |
|---|---|---|---|
| 1 | mint/iso (Linux distribution, disc images) | 1517 | 2 / 1381 |
| 2 | kiwix (offline Wikipedia) | 807 | 3 / 1106 |
| 3 | almalinux (Linux distribution) | 741 | 6 / 353 |
| 4 | fdroid (Free and Open-Source Android app repository) | 669 | 1 / 1794 |
| 5 | cdn.media.ccc.de (recordings of IT-related events) | 651 | 8 / 273 |
| 6 | opensuse (Linux distribution) | 592 | 5 / 354 |
| 7 | gimp (Free and Open-Source image manipulation program) | 541 | 15 / 203 |
| 8 | fedora (Linux distribution) | 510 | 4 / 438 |
| 9 | macports | 383 | 9 / 263 |
| 10 | rockylinux | 382 | 18 / 182 |
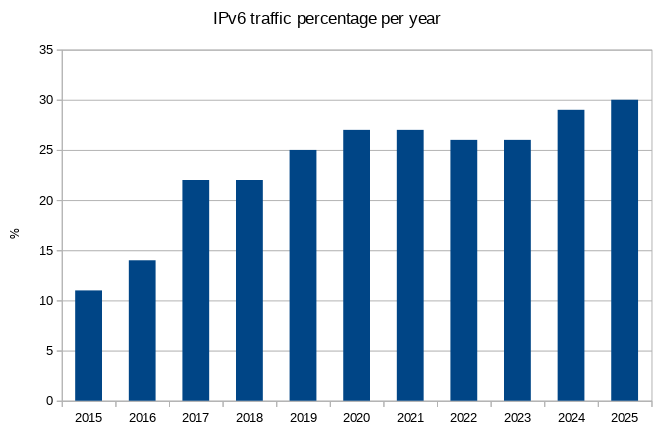
The percentage of IPv6 traffic increased marginally to 30% (3.02 PiB), after 29% in 2024, 26% in 2023, 26% in 2022, 27% in 2021, 27% in 2020, 25% in 2019, 22% in 2018, 22% in 2017, 14% in 2016 and 11% in 2015.
Actually, lets make a graph for that:
A few things are notable this year.
First, the traffic to the fdroid mirror has dropped dramatically. One of the main causes of that was that we blocked a few abusive users that kept downloading the same files over and over again in an apparent endless loop intended to waste traffic – often multiple TB a day. Again, we do not mind any kind of useful traffic at all – but downloading the same file 50000 times in a day over two weeks stretches our definition of “useful” a bit too far.
While we’re on the topic of useless, we’re a bit surprised that despite AI (and their scrapers), our overall traffic has not really increased last year. It seems the useless AI scrapers prefer the universitys main website over our “fileserver” (Note: We’re not complaining! Please keep sparing us!).
On the topic of new entries into our Top 10, the first one is “rockylinux”, which means that now both of the two replacements for what used to be CentOS that we mirror are in the Top 10 (“almalinux” already made an entry last year). The second newcomer is not really new – it’s “gimp”, which was in the Top 10 multiple times before, just not in 2024. No longer in the Top 10 are “epel” (now rank 19) and “ubuntu” (rank 11).