Georg Hager's Blog

Random thoughts on High Performance Computing

Inhalt

New tutorial on “Core-Level Performance Engineering” accepted for ICPE 2023

ICPE 2023 LogoOur brand-new tutorial “Core-Level Performance Engineering” has been accepted as a full-day tutorial at ICPE 2023, the 14th ACM/SPEC International Conference on Performance Engineering. This tutorial concentrates on the in-core aspects of performance modeling and analysis on CPUs. We use Matt Godbolt’s Compiler Explorer and our Open-Source Architecture Code Analyzer (OSACA), which is now integrated with the Compiler Explorer, to teach the basics of code execution including pipelining, superscalarity, SIMD, intra-iteration and loop-carried dependencies, and more. Intel/AMD x86 and ARM Neon/SVE assembly code is introduced, and participants can get their hands dirty exploring the depths of machine code execution using only a web browser! Lead OSACA developer Jan Laukemann did most of the work for this exciting new event. Find the details at: https://icpe2023.spec.org/tutorials/tutorial3/.

All slides and some of the exercises are available at: http://tiny.cc/CLPE.

Gprofng is the next-generation GNU profiler

This week, Ruud van der Pas of OpenMP fame gave a talk in our NHR PerfLab seminar on gprofng, the next-generation GNU profiling tool. If you ever felt that gprof was sorely lacking features like threading support, sampling, and drilling down to source, gprofng comes to rescue. Now you can profile code without even recompiling it, which comes in handy (not only) if you don’t have the source. It has recently been accepted as part of the Linux binutils package and will inevitably find its way into standard Linux distros. If you don’t want to wait that long, clone the development repo with

git clone git://sourceware.org/git/binutils-gdb.git

and compile it yourself. Here’s the recording of Ruud’s talk, where he explains the basic functions of gprofng and also takes a peek at upcoming features like HTML output and hardware performance counter support:

LIKWID 5.2.1 is out!

LIKWID stickersLIKWID 5.2.1 is out! This bugfix release addresses a lot of small and not-so-small issues:

  • Support for Intel Rocket Lake and AMD Zen3 variant (Family 19, Model 0x50)
  • Fix for perf_event multiplexing (important!)
  • Fix for a potential deadlock in MarkerAPI (thx @jenny-cheung)
  • Build and runtime fixes for Nvidia GPU backend, updates for CUDA test codes
  • likwid-bench “peakflops” kernel for ARMv8
  • Updates for AMD Zen1/2/3 event lists and groups
  • Support spaces in MarkerAPI region tags (thx @jrmadsen)
  • Use ‘online’ cpulist instead of ‘present’
  • Check PID if given through –perfpid
  • Intel Icelake: OFFCORE_RESPONSE events
  • likwid-mpirun: Set MPI type for SLURM automatically
  • likwid-mpirun: Fix skip mask for OpenMPI
  • Fix for triad_sve* benchmarks

You can download the new version from the FTP or GitHub.

Upcoming: 38th VI-HPS Online Tuning Workshop, March 1-3, 2021

It is our pleasure to announce the 38th VI-HPS Tuning Workshop, organized by NHR@FAU. FAU is a member of VI-HPS, the “Virtual Institute – High Productivity Supercomputing.” The mission of VI-HPS is to to improve the quality and accelerate the development process of complex simulation programs in science and engineering that are being designed for the most advanced parallel computer systems.

To this end, VI-HPS organizes a series of tuning workshops that introduce advanced performance analysis tools. This workshop will:

  • give an overview of the VI-HPS programming tools suite,
  • explain the functionality of individual tools, and how to use them effectively,
  • offer hands-on experience and expert assistance using the tools.

In this particular event, we will cover the tools TAU , MAQAO, Score-P, Paraver/Extrae/Dimemas, and Extra-P. On completion participants will be familiar with common performance analysis and diagnosis techniques and how they can be employed in practice. Those who prepared their own application test cases will have been coached in the tuning of their measurement and analysis, and provided optimization suggestions.

Important: Note that this workshop is aimed at HPC developers. Participants must be familiar with handling a Linux environment over an SSH connection, basic parallel programming, and working with a batch system. There will be no time to teach these topics during the workshop.

Workshop dates: March 1-3, 2021, 9:00-17:00

More information (agenda, registration) is available on the workshop page. You can register directly by sending an e-mail to georg.hager@fau.de with the following information:

  • Your full name
  • Your affiliation
  • Your country of residence

Participation is free of charge. Please register only if you are really planning to attend. No-shows will be blacklisted and excluded from future events.

Tutorial: Empirical Roofline model with LIKWID

Thomas Gruber (a.k.a. TomTheBear), the main developer of the LIKWID tool suite, has published a short tutorial about constructing empirical Roofline models with likwid-perfctr.  An empirical Roofline model uses measurements of computational intensity and performance to compare the resource utilization of running code with the limits set by the hardware.

Tutorial: Empirical Roofline Model

This is something that often comes up as a question in our node-level or tools courses. Keep in mind that the computational intensity can also be predicted analytically if you know enough about the loop(s) in your application and the properties of the hardware. Comparing the analytical prediction with the measurement and the machine limits is a powerful way to analyze the performance of code. You can learn more about this, and more, in one of our Node-Level Performance Engineering tutorials.

LIKWID 5.1 released

We are happy to announce a new major release 5.1.0 of LIKWID. This release adds support for the latest and upcoming architectures. Besides numerous bug fixes, these are the major new features:

  • Support for Intel Icelake desktop (Core + Uncore)
  • Support for Intel Icelake server (Core only)
  • Support for Intel Tigerlake desktop (Core only)
  • Support for Intel Cannon Lake (Core only)
  • Support for Nvidia GPUs with compute capability >= 7.0 (CUpti Profiling API)
  • Initial support for Fujitsu A64FX (Core) including SVE assembly benchmarks
  • Support for ARM Neoverse N1 (AWS Graviton 2)
  • Support for AMD Zen3 (Core + Uncore but without any events)
  • Fortran 90 interface for NvMarkerAPI (update)

We want to thank Intel, AMD, AWS and the University of Regensburg for their support.

LIKWID 5.0.2 released

We are happy to announce a new release 5.0.2 of LIKWID. It is mainly a bugfix release, but it also has some important updates for modern architectures (IBM Power9, AMD Zen[2]). If you want to use LIKWID on AMD Zen/Zen2 systems, we highly recommend updating. Thanks to HLRS and LANL for valuable input.

Here is the full Changelog:

  • Fix memory leak in calc_metric()
  • New peakflops benchmarks in likwid-bench
  • Fix for NUMA domain handling
  • Improvements for perf_event backend
  • Fix for perfctr and powermeter with perf_event backend
  • Fix for likwid-mpirun for SLURM with cpusets
  • Fix for likwid-setFrequencies in cpusets
  • Update for POWER9 event list
  • Updates for AMD Zen, Zen+ and Zen2 (events, groups)
  • Fix for Intel Uncore events with same name for different devices
  • Fix for file descriptor handling
  • Fix for compilation with GCC10
  • Remove sleep timer warning
  • Update examples C-markerAPI and C-internalMarkerAPI

Get the download from our FTP server: ftp://ftp.fau.de/mirrors/likwid/

Problems with GPU measurements on recent Nvidia GPUs are not addressed with this release. The fixes will be part of the 5.1.0 release (including support for Fujitsu A64FX and ARM Neoverse N1).

Introducing the MachineState reproducibility tool

MachineState is a python3 module and CLI application for documenting and comparing settings known to affect application performance: e.g., CPU/Uncore frequencies, hardware prefetchers, memory capacity, but also OS and software settings like NUMA balancing, writeback workqueues, scheduling, or the versions of common tools and libraries (e.g., compilers and MPI). All this information can be essential for reproduction of benchmark results. The MachineState tool gathers all (known) settings and presents them as a JSON document. A state file written earlier can be compared to the current machine state to uncover deviations from  the original test system.
Check out the MachineState github project, maintained by Thomas “TomTheBear” Gruber

PMBS19 Workshop Best Late-Breaking Paper Award

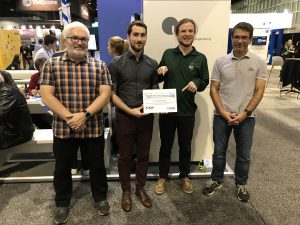
The authors proudly presenting the award at the Bavarian Supercomputing Alliance booth at SC19.

Our paper “Automatic Throughput and Critical Path Analysis of x86 and ARM Assembly Kernels” has just won the “Best Late-Breaking Paper Award” at the 10th Workshop on Performance Modeling, Benchmarking and Simulation of High Performance Computer Systems (PMBS19), a renowned workshop co-located with the SC19 conference. The lead author, our master student Jan Laukemann, presented his work on a new version of the OSACA tool (Open-Source Architecture Code Analyzer), which now supports throughput, critical path, and loop-carried dependency analysis for assembly loop kernels on x86 and ARM architectures. It is thus a critical component for ECM and Roofline modeling and can be used as a more capable substitute for Intel’s discontinued IACA tool.

LIKWID 5.0 is here

LIKWID stickers

Laptop decorations available at SC19!

Just in time for SC19, version 5 of our popular LIKWID tool suite has been released. There are tons of new developments in there; these are the most important ones:

  • Support for ARM architectures, especially for Marvell Thunder X2
  • Support for IBM POWER architectures (POWER8 and POWER9)
  • Support for AMD Zen2 and for data fabric counters of the AMD Zen microarchitecture
  • Support for Nvidia GPU monitoring (with NvMarkerAPI)
  • New clock frequency backend (with less overhead)
  • Generation of benchmarks for likwid-bench on-the-fly from ptt files
  • Integration of GOTCHA for hooking into client applications at runtime
  • Thread-local initialization of streams for likwid-bench
  • Enhanced support for SLURM with likwid-mpirun
  • New MPI and Hybrid pinning features for likwid-mpirun
  • JSON output filter file (use -o output.json)
  • Updated quick reference sheet with all the new options

The full list is available at the github release page. And if you need something really cool to cover that empty spot on your laptop lid, we’ll have LIKWID stickers available during our SC19 tutorial “Node-Level Performance Engineering” and at the Bavarian Supercomputing booth (#2063).

Direct download from FAU FTP

LIKWID documentation Wiki

Github project