Georg Hager's Blog

Random thoughts on High Performance Computing

Inhalt

Tutorial: Empirical Roofline model with LIKWID

Thomas Gruber (a.k.a. TomTheBear), the main developer of the LIKWID tool suite, has published a short tutorial about constructing empirical Roofline models with likwid-perfctr.  An empirical Roofline model uses measurements of computational intensity and performance to compare the resource utilization of running code with the limits set by the hardware.

Tutorial: Empirical Roofline Model

This is something that often comes up as a question in our node-level or tools courses. Keep in mind that the computational intensity can also be predicted analytically if you know enough about the loop(s) in your application and the properties of the hardware. Comparing the analytical prediction with the measurement and the machine limits is a powerful way to analyze the performance of code. You can learn more about this, and more, in one of our Node-Level Performance Engineering tutorials.

LIKWID 5.1 released

We are happy to announce a new major release 5.1.0 of LIKWID. This release adds support for the latest and upcoming architectures. Besides numerous bug fixes, these are the major new features:

  • Support for Intel Icelake desktop (Core + Uncore)
  • Support for Intel Icelake server (Core only)
  • Support for Intel Tigerlake desktop (Core only)
  • Support for Intel Cannon Lake (Core only)
  • Support for Nvidia GPUs with compute capability >= 7.0 (CUpti Profiling API)
  • Initial support for Fujitsu A64FX (Core) including SVE assembly benchmarks
  • Support for ARM Neoverse N1 (AWS Graviton 2)
  • Support for AMD Zen3 (Core + Uncore but without any events)
  • Fortran 90 interface for NvMarkerAPI (update)

We want to thank Intel, AMD, AWS and the University of Regensburg for their support.

PMACS 2020 Workshop Call for Papers

Euro-Par 2020, Warsaw, PolandThe Euro-Par conference is a well-established venue for presenting and discussing research on parallel computing in Europe. In association with the Euro-Par 2020 conference, which takes place from August 24-28 in Warsaw, Poland, the workshop “PMACS – Performance Monitoring and Analysis of Cluster Systems” is organized by Thomas Gruber from our group. The workshop offers presentations and exchange of experience about various solutions on the collection, transmission, storage, evaluation, and visualization of runtime data about the hard- and software of whole cluster systems.

Weiterlesen

Node-Level Performance Engineering Course at LRZ

We proudly present a retake of our PRACE course on “Node-Level Performance Engineering” on December 3-4, 2019 at LRZ Garching.

This course covers performance engineering approaches on the compute node level. Even application developers who are fluent in OpenMP and MPI often lack a good grasp of how much performance could at best be achieved by their code. This is because parallelism takes us only half the way to good performance. Even worse, slow serial code tends to scale very well, hiding the fact that resources are wasted. This course conveys the required knowledge to develop a thorough understanding of the interactions between software and hardware. This process must start at the core, socket, and node level, where the code gets executed that does the actual computational work. We introduce the basic architectural features and bottlenecks of modern processors and compute nodes. Pipelining, SIMD, superscalarity, caches, memory interfaces, ccNUMA, etc., are covered. A cornerstone of node-level performance analysis is the Roofline model, which is introduced in due detail and applied to various examples from computational science. We also show how simple software tools can be used to acquire knowledge about the system, run code in a reproducible way, and validate hypotheses about resource consumption. Finally, once the architectural requirements of a code are understood and correlated with performance measurements, the potential benefit of code changes can often be predicted, replacing hope-for-the-best optimizations by a scientific process.

This is a two-day course with demos. It is provided free of charge to members of European research institutions and universities.

 Date: Tuesday, Dec 3, 2019 09:00 – 17:00
Wednesday, Dec 4, 2019 09:00 – 17:00
Location: LRZ Building, University campus Garching, near Munich, Hörsaal H.E.009 (Lecture hall)
Course webpage with detailed agenda: https://events.prace-ri.eu/event/901/
Registration: Via https://events.prace-ri.eu/event/901/registrations/633/

LIKWID 5.0 is here

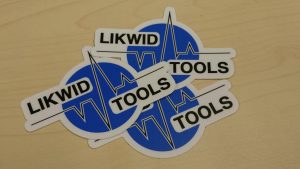
LIKWID stickers

Laptop decorations available at SC19!

Just in time for SC19, version 5 of our popular LIKWID tool suite has been released. There are tons of new developments in there; these are the most important ones:

  • Support for ARM architectures, especially for Marvell Thunder X2
  • Support for IBM POWER architectures (POWER8 and POWER9)
  • Support for AMD Zen2 and for data fabric counters of the AMD Zen microarchitecture
  • Support for Nvidia GPU monitoring (with NvMarkerAPI)
  • New clock frequency backend (with less overhead)
  • Generation of benchmarks for likwid-bench on-the-fly from ptt files
  • Integration of GOTCHA for hooking into client applications at runtime
  • Thread-local initialization of streams for likwid-bench
  • Enhanced support for SLURM with likwid-mpirun
  • New MPI and Hybrid pinning features for likwid-mpirun
  • JSON output filter file (use -o output.json)
  • Updated quick reference sheet with all the new options

The full list is available at the github release page. And if you need something really cool to cover that empty spot on your laptop lid, we’ll have LIKWID stickers available during our SC19 tutorial “Node-Level Performance Engineering” and at the Bavarian Supercomputing booth (#2063).

Direct download from FAU FTP

LIKWID documentation Wiki

Github project

SC19 incoming!

This year at SC19 in Denver, CO, members of our group will be part of numerous contributions:

  • Our master student Jan Laukemann will present the paper “Automatic Throughput and Critical Path Analysis of x86 and ARM Assembly Kernels” at the PMBS 2019 workshop. It describes recent improvements to our “Open Source Architecture Code Analyzer” (OSACA), notably support for ARM architectures and critical path detection. This paper has received the Best Short Paper Award at the workshop.
  • Our accepted research poster “INSPECT Intranode Stencil Performance Evaluation Collection” by Julian Hammer et al. will showcase INSPECT, our open and extensible collection of performance data and models for stencil codes.
  • Our accepted research poster “LIKWID 5: Lightweight Performance Tools” by Thomas Gruber et al. will showcase the latest developments in our LIKWID performance tool suite.
  • The popular full-day tutorial “Node-Level Performance Engineering” will be presented again by Gerhard Wellein and myself.

And finally, we are again part of the activities at the LRZ booth (#2063), where “Bits, Bytes, Brezn & Beer – Supercomputing in Bavaria” is on the agenda. Drop by during the opening gala to chat and get your share of Bavarian (and Franconian) ambience.

LIKWID 4.3.4 released

LIKWID 4.3.4 is a bugfix release.  These are the relevant changes:

  • For systems using Intel Cluster-on-Die (CoD) or Sub-NUMA Clustering (SNC):
    • Fix for detecting PCI devices
    • Workaround for topology detection. The Linux kernel does not detect it properly sometimes.
  • Don’t pin accessDaemon to SMT threads to avoid long access latencies due to busy hardware thread
  • Fix for calculations in likwid-bench if streams are used for input and output
  • Fix for LIKWID_MARKER_REGISTER with perf_event backend
  • Support for Intel Atom (Tremont) (nothing new, same as Intel Atom Goldmont Plus)
  • Minor updates for build system
  • Minor updates for documentation

Download the new version from our FTP server or directly from github:

ftp://ftp.rrze.uni-erlangen.de/mirrors/likwid/likwid-4.3.4.tar.gz
https://github.com/RRZE-HPC/likwid/releases/tag/4.3.4

A LIKWID bouquet

The note says: “For the name ‘LIKWID’ – because it keeps conjuring a smile on my lips.”

Just got this from an anonymous fan. The note says: “For the name ‘LIKWID’ – because it keeps conjuring a smile on my lips.” You’re most welcome, whoever you are.

For those who don’t know, LIKWID is our multicore performance tool suite. I’m not a developer (Thomas Gruber [né Röhl] does the hard work there), but I happen to be the one who came up with the acronym: “Like I Knew What I’m Doing.”

LIKWID marker overhead and “Meltdown” patches

The Marker API of likwid-perfctr lets you count hardware events on your CPU core(s) separately for different execution regions. E.g., in order to count events for a loop, you would use it like this:

#include <likwid.h>

int main(...) {
  // always required once
  LIKWID_MARKER_INIT;
  // ...
  LIKWID_MARKER_START("loop");
  for(int i=0; i<n; ++i) {
    do_some_work();
  }
  LIKWID_MARKER_STOP("loop");
  // ...
  LIKWID_MARKER_CLOSE;
  return 0;
}

An arbitrary number of regions is allowed, and you can use the LIKWID_MARKER_START and LIKWID_MARKER_STOP macros in parallel regions to get per-core readings. The events to be counted are configured on the likwid-perfctr command line. As with anything that is not part of the actual work in a code, one may ask about the cost of the marker API calls. Do they impact the runtime of the code? Does the number of cores play a role? Weiterlesen