Georg Hager's Blog

Random thoughts on High Performance Computing

Content

Fooling the masses – Stunt 11: Show data! Plenty. And then some.

(See the prelude for some general information on what this is all about)

ShowDataPlenty_Bars

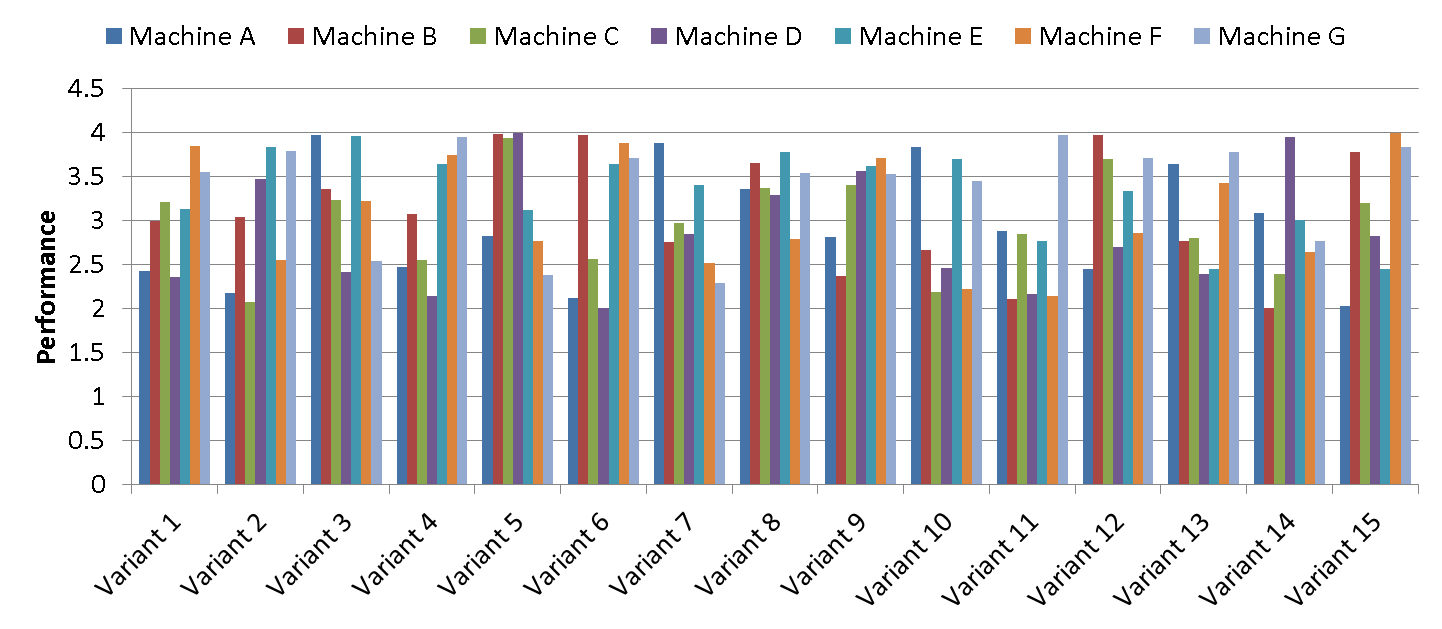
Figure 1: Lots of variants of an experiment, lots of machines, no idea for interpretation – why not show it all?

Computers produce data. Parallel computers produce more data. And doing performance experiments with parallel computers produces even more data, since we often conduct several runs with different code variants on different machines. Now imagine a situation where you’ve got all this data lying around on your disk, but you can’t make any sense of it. Since you wouldn’t bother to establish even a coarse performance model (your setup is just too complex for this kind of bean counting), you don’t know whether some particular performance measurement is “good” or “bad” on some particular machine, or how performance should change when some parameter is altered.

Why not put the cart before the horse and show all the data? This has decisive advantages: You can display all the work you did, without the embarrassing message that five or six numbers is all the relevant data you got from your research. Furthermore, it gives you the opportunity to add “discussion” at any desirable level of detail. For instance, if the page limit for submitting to your favorite conference is ten pages, and you have five pages full of messy bar graphs (such as the one shown in Fig. 1), you can easily fill the rest with meaningless “explanations” like “Variant 11 shows about 90% performance advantage on Machine G over Variant 10 on Machine F while, surprisingly, Variant 9 on Machine A is 6% slower than Variant 7 on Machine C.” You may want to write “92.23%” and “5.982%” here – see Stunt 8 for the reason.

In Summary, you can make up for your lack of insight by showing data. Plenty of it. Swamp your readers or your audience with hundreds of colorful bar graphs, scatter plots, timing diagrams, or whatever your favorite data visualization tool has to offer, and describe them at length. If you really want to leave the impression of true understanding, resort to obscure technical details − but this is the theme of another stunt.


Fooling the masses – Stunt 10: Always emphasize the “interesting” part of your work!

(See the prelude for some general information on what this is all about)

Have you ever thought about how to improve the aerodynamic properties of bulldozers? Yes? Then this stunt is for you.

Bulldozer aeodynamics

Figure 1: Always focus on the interesting stuff!

Code optimization is quite rewarding at times. You put all your effort into mutilating a chunk of code beyond all recognition, and in the end you get a 50% speedup. Often enough, this work requires a great deal of  expertise at the interface between hardware and software. And you certainly want to present your success to your peers so they understand how advanced you are.

If you do such a thing, don’t bother picking the low-hanging fruits. When 95% of the run time goes into a boring loop nest which multiplies a dense matrix with a vector, there is not much you can do beyond the standard textbook stuff – or use a library altogether. However, if the remaining 5% consist of a convoluted communication scheme, you’ve found your target. The fact that the possible gain is at most 5% shouldn’t stop you, because it’s all a matter of presentation; see Fig. 1: 3D bars and a proper choice of scales on the axes guide the reader’s eye and help you drive home your point. It’s like presenting the optimized drag coefficient of your aerodynamically improved bulldozer on high gloss paper, and the boring technical data in small black print on a dark blue background, on the back page.

Interestingly, if the optimization target is communication, or synchronization, or any other non-computational overhead, this stunt can be made to work even better: When you strongly scale to a pointless number of workers, reducing such overheads will give you arbitrary speedups, far beyond the factor of two that is theoretically possible if you restrict yourself to a sensible minimum parallel efficiency of 50%. Coming back to the heavy gear analogy, if you accelerate your bulldozer to 200 mph, the drag coefficient does become essential, and you may feel vindicated. It won’t solve any real-world problem, but hey, this is research after all.

Thanks to Gerhard Wellein for discovering this stunt in a paper. Many papers, actually.