 This year at SC19 in Denver, CO, members of our group will be part of numerous contributions:
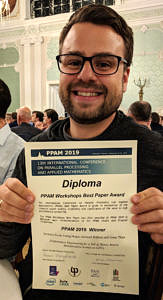
- Our master student Jan Laukemann will present the paper “Automatic Throughput and Critical Path Analysis of x86 and ARM Assembly Kernels” at the PMBS 2019 workshop. It describes recent improvements to our “Open Source Architecture Code Analyzer” (OSACA), notably support for ARM architectures and critical path detection. This paper has received the Best Short Paper Award at the workshop.
- Our accepted research poster “INSPECT Intranode Stencil Performance Evaluation Collection” by Julian Hammer et al. will showcase INSPECT, our open and extensible collection of performance data and models for stencil codes.
- Our accepted research poster “LIKWID 5: Lightweight Performance Tools” by Thomas Gruber et al. will showcase the latest developments in our LIKWID performance tool suite.
- The popular full-day tutorial “Node-Level Performance Engineering” will be presented again by Gerhard Wellein and myself.
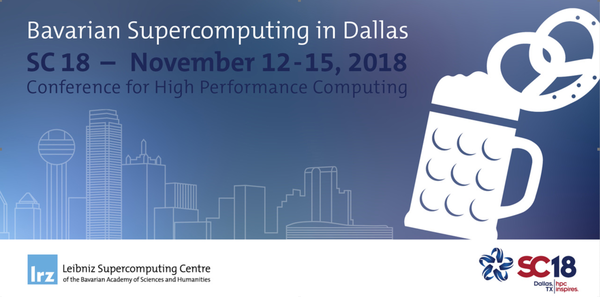
And finally, we are again part of the activities at the LRZ booth (#2063), where “Bits, Bytes, Brezn & Beer – Supercomputing in Bavaria” is on the agenda. Drop by during the opening gala to chat and get your share of Bavarian (and Franconian) ambience.

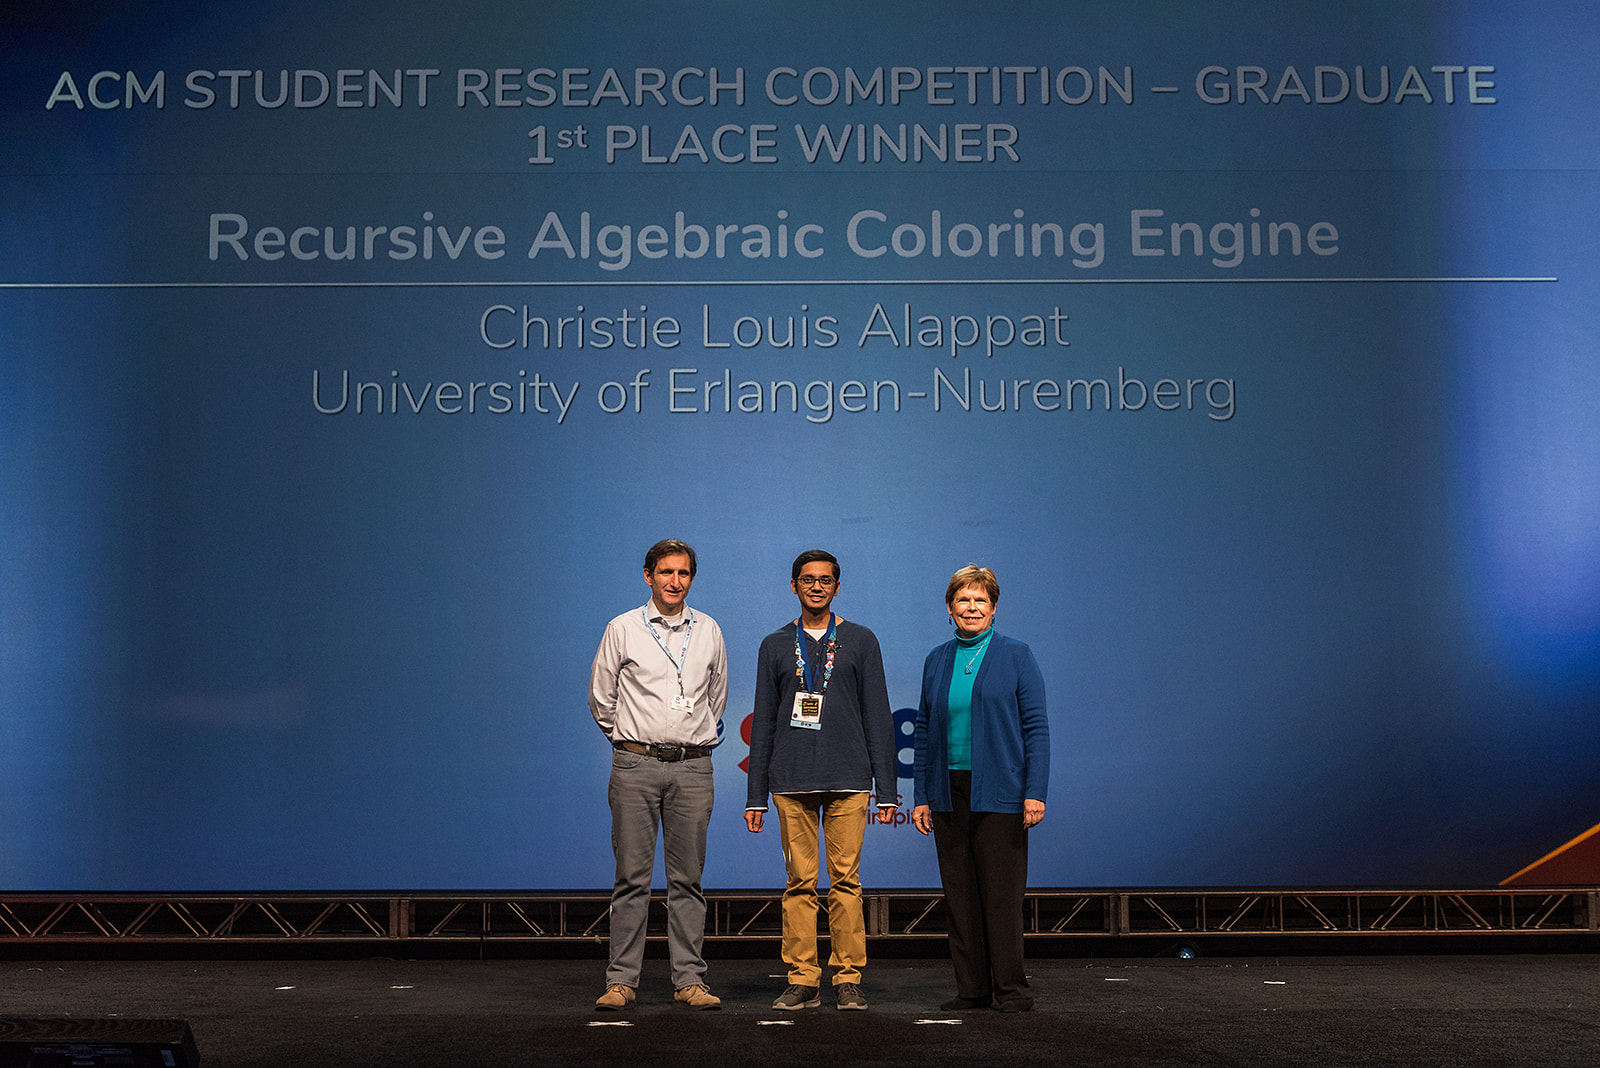
 Our PhD student Christie Louis Alappat, by