(See the prelude for some general information about what this is all about)
Sometimes a data plot just isn’t straight enough. You know that your code scales, but the bloody cluster stubbornly ignores this fact and the performance graph looks like a skew-whiff banana:
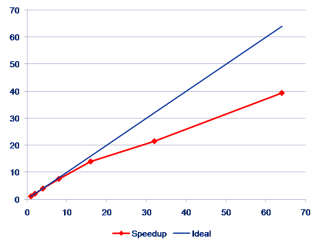
How are you supposed to drive your point home? Do not despair! Help is on the way. We’ll be guided by the Great Old Ones and just use a log scale. Whether it’s lin-log, log-lin, or log-log should be determined according to your particular needs for obfuscation. The point is that a log scale tends to underemphasize deviations between graphs in the same plot. Here we have chosen the log-log variant:
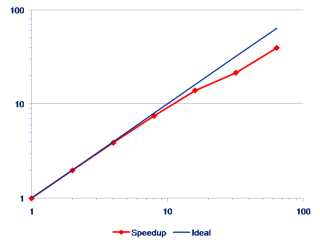
Doesn’t this look much nicer? You can easily attach the “almost linear scaling” label to it, although parallel efficiency is barely above 60% at the largest number of workers.