(See the prelude for some general information on what this is all about)
“Qualitative” statements make you cringe. Being a scientist, you know that science is all about accuracy. And what could be more accurate than numbers? Good for you! There is ample opportunity for generating numbers in computer science. The art is to not block your audience’s view on the raw and unfiltered truth.
| # cores | Time (plain) [s] | Time (optimized) [s] | Speedup [%] |
|---|---|---|---|
| 1 | 12.0435766 | 8.6198441 | 39.71919283 |
| 2 | 6.1179025 | 5.5901951 | 9.439874469 |
| 3 | 4.9041394 | 4.6966098 | 4.418710705 |
| 4 | 4.7002801 | 4.6912042 | 0.193466317 |
A simple example: When comparing performance numbers between different machines or code versions (see Stunt 7 for some amazing tricks you can play there), don’t hesitate to provide timings with sub-microsecond resolution, even if the results fluctuate like mad. Then state, in a slightly generalizing, “management-style” demeanor, that your “optimizations lead to a performance increase of up to 39.71919283%”, and refer to the data (see the table) to substantiate your assertion. In other words, forget what your high school teachers told you about significant digits and use the full power of your pocket calculator, even if a slide rule would also do the trick.
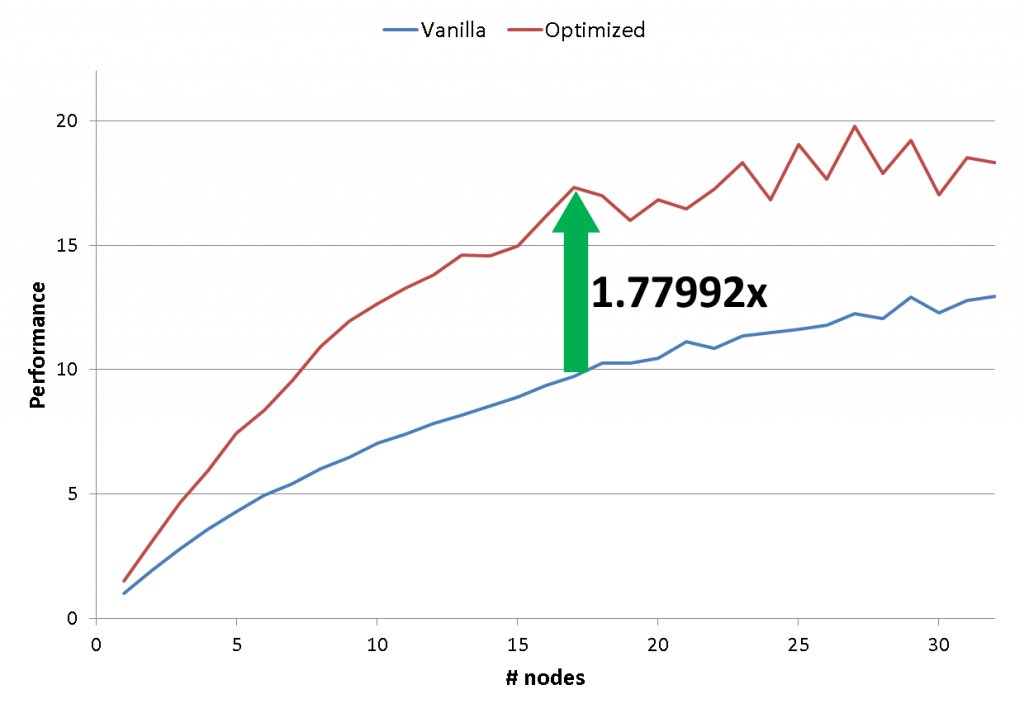
By the way, the same works for drawing conclusions from data in diagrams. Since it is sometimes hard to read off precise values from graphs, help your audience by stating the raw facts (see Fig. 1). Using boldface and jazzy colors will help to keep peoples’ attention on the important messages. Do not waste time and space dealing with lengthy explanations but let the numbers speak for themselves!
