This post is not about high performance computing, for a change; it does, however, have a distinct performance-related vibe, so I think it qualifies for this blog. Besides, I had so much fun solving this riddle that I just cannot keep it to myself, so here goes.
D/A conversion with Arduino and ZN426
I was always interested in digital signal processing, and recently I decided to look into an old drawer and found a couple of ZN426E8 8-bit D/A converters that I had bought in the 80s. I asked myself whether a standard Arduino Uno with its measly 16 MHz ATmega 328 processor would be able to muster enough performance to produce waveforms in the audio range (up to at least a couple of kHz) by copying bytes from a pre-computed array to the D/A converter. The ZN426 itself wouldn’t be a bottleneck in this because it’s just an R-2R ladder with a worst-case settling time of 2 µs, which leads to a Nyquist frequency of 250 kHz. Ample headroom for audio. At 16 MHz, 2 µs means 32 clock cycles, so it shouldn’t really be a problem for the Arduino as well even with compiled code. Or so I thought.
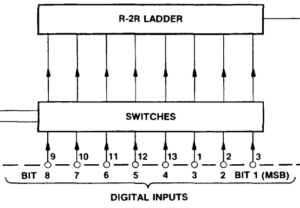
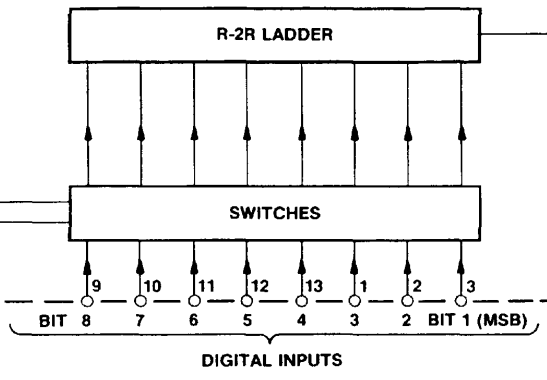
Fig. 1: The input lines of the D/A converter are numbered with bit 8 being the LSB (image cut from the Plessey data sheet for the ZN426E8)
So I hooked up the digital output lines of port D on the Uno to the input lines of the D/A converter and added the other necessary components according to the minimal example in the data sheet (basically a resistor and a capacitor needed by the internal 2.55 V reference). Unfortunately, the ZN426 data sheet uses an unusual numbering of the bits: bit 1 is the MSB, and bit 8 is the LSB. I missed that and inadvertently mirrored the bits, which led to an “interesting” waveform the first time I fired up the program. Now instead of fixing the circuit, I thought I could do that in software; just mirror the bits before writing them out to PORTD:
// output bytes in out[]
for(int i=0; i<N; i++) {
  unsigned char d=0;
  // mirror the bits in out[i], result in d
  for(int j=0; j<=7; ++j){
    unsigned char lmask = 1 << j, rmask = 128 >> j;
    if(out[i] & lmask) d |= rmask;
  }
  PORTD = out[i];
}
I knew that this was just a quick hack and that one could do it faster, but I just wanted the waveform to look right, and then care for performance. By the way, shift and mask operations should be fast, right? As a first test I wanted to approximate a square wave using Fourier synthesis:
f(t)=\sin t +\frac{1}{3}\sin 3t+\frac{1}{5}\sin 5t+\ldots
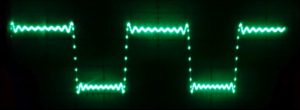
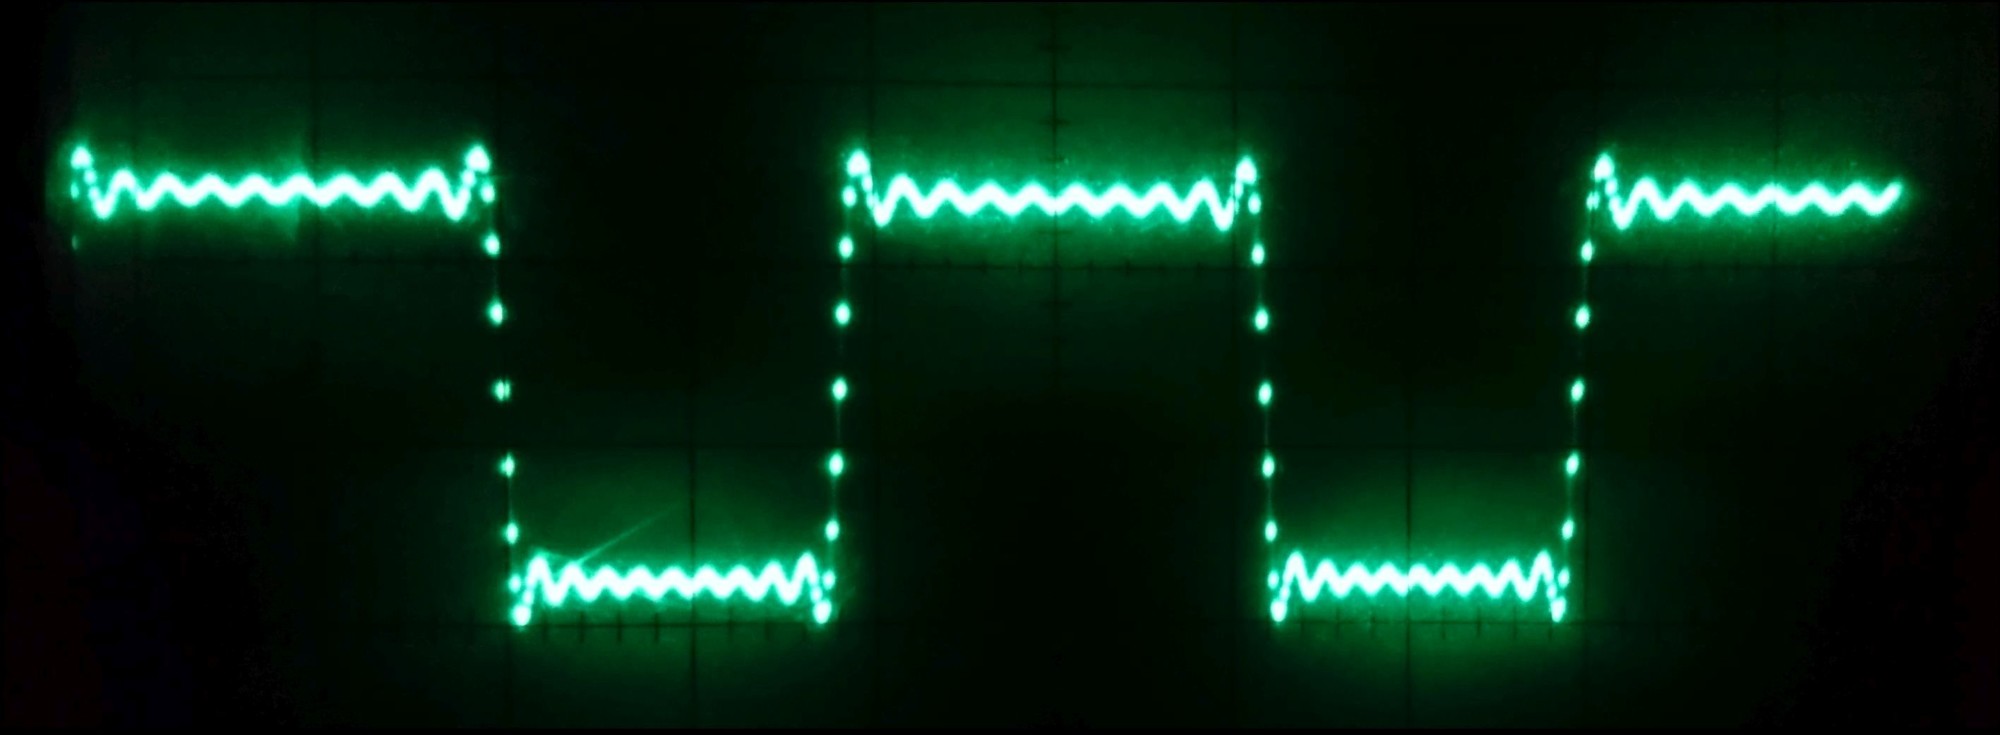
Fig. 2: Fourier-synthesized square wave (first 20 harmonics) with wrong duty cycle
The problem
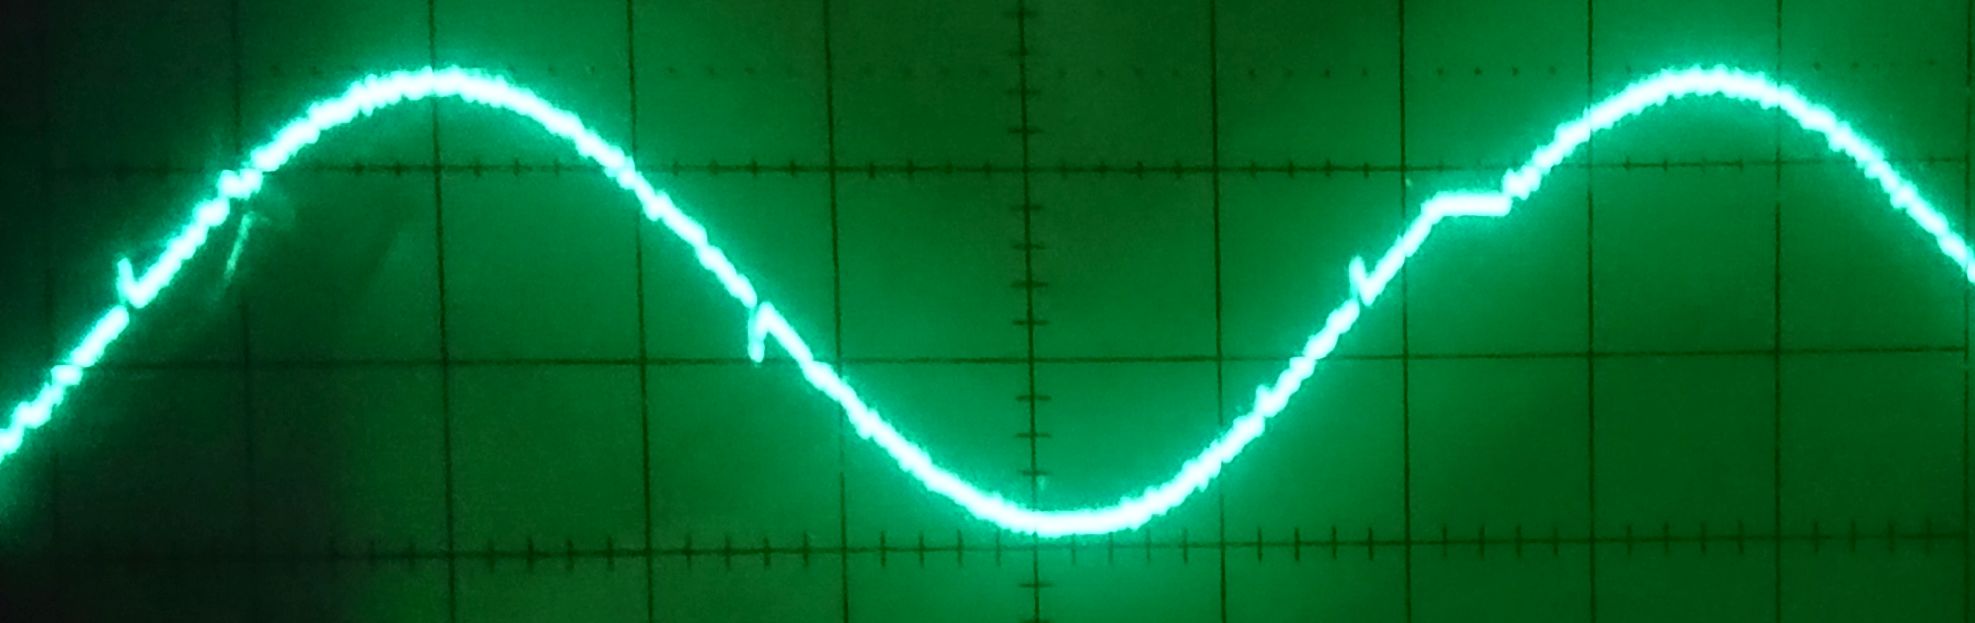
Of course, the resulting function was then shifted and scaled appropriately to map to the range {0,…,255} of the D/A input. As a test, I used 200 data points per period and stopped at 20 harmonics (10 of which were nonzero). On first sight, the resulting waveform looked OK on the scope (see Fig. 2): the usual Gibbs phenomenon near the discontinuities, the correct number of oscillations. However, the duty cycle was not the expected 1:1 but more like 1.3:1. I first assumed some odd programming error, so I simplified the problem by using a single Fourier component, a simple sine wave. Figure 3 shows the result: It was obviously not a correct sine function, since the “arc” at the top is clearly blunter than that at the bottom. So it wasn’t some bug in the Fourier synthesis but already present in the fundamental harmonic.
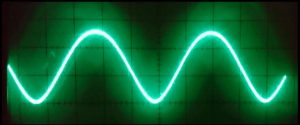
Fig. 3: This sine function is not quite a sine function
Bug hunting
In order to track the bug I made some experiments. First I compiled an adapted version of the code on my PC so I could easily inspect and plot the data in the program. It turned out that the math was correct – when plotting the out[] array, I got exactly what was expected, without distortions. Although this was reassuring, it left basically two options: Either it was an “analog” problem, i.e., something was wrong with the linearity of the D/A converter or with its voltage reference, or the timing was somehow off so that data points with high voltages took longer to output.
To check the voltage reference, I tried to spot fluctuations with the scope hooked up to it, but there was nothing – the voltage was at a solid 2.5 V (ish), and there was no discernible AC component visible within the limitations of my scope (a Hameg HM 208, by the way); a noise component of 20 mVpp would have been easily in range. The next test involved the timing: I inserted a significant delay (about 200 µs) after writing the byte to PORTD. This reduced the output frequency quite a bit since the original code spat out one byte about every 20 µs. Lo and behold – the asymmetries were gone. At this point it should have dawned on me, but I still thought it was an analog problem, somehow connected to the speed at which the D/A converter settles to the correct output voltage. However, the specs say that this should take at most 2 µs, so with one new value every 20 µs I should have been fine.
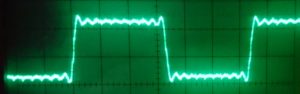
Fig. 4: Correct duty cycle after rewiring the D/A input lines
The solution
In the end, out of sheer desperation I decided to take out the last bit of complexity and rewired the D/A input bits so that the byte-mirror code became obsolete. Figure 4 shows the resulting output voltage for the square wave experiment. There are two major observations here: (1) The duty cycle was now correct at 1:1, and (2) the performance of the code was greatly improved. Instead of one value every 20 µs it now wrote one value every 550 ns (about 9 clock cycles). Problem solved – but why?
The observation that the nonlinearity disappeared when I inserted a delay was the key. In the byte-mirror code above, the more bits in the input byte out[i] are set to one, the more often the if() condition is true and the or-masking of the output byte d takes place. In other words, the larger the number of one-bits, the longer it takes to put together the output byte. And since voltages near the maximum are generated by numbers close to 255 (i.e., with lots of set bits), a phase in the output waveform with a large average voltage used a longer time step than one with a low average voltage. In other words, the time step had a component that was linear in the Hamming weight (or popcount) of the binary output value.
Of course I did some checks to confirm this hypothesis. Rewriting the byte-mirror code without an if condition (instead of rewiring the data lines) fixed the problem as well:
for(int i=0; i<N; i++) {
  unsigned char d=0,lmask=1,rmask=128,v;
  for(unsigned char j=0; j<=7; ++j){
    v = out[i] & lmask;
    d |= (v<<(7-j))>>j;
  }
  PORTD = d;
}
There are many ways to do this, but all resulted in (1) correct output and (2) slow code, more than an order of magnitude slower than the “plain” code with correctly wired data lines. Whatever I tried to mirror the bits, it always took a couple hundred cycles.
In summary, a problem which looked like a nonlinearity in a D/A converter output was actually caused by my code taking longer when more bits were set in the output, resulting in a larger time step for higher voltages.
Odds and ends

Fig. 5: At a time step of roughly half a microsecond, the behavior of the D/A converter and the Arduino become visible
Without mirroring, the time step between successive updates is much smaller than the worst-case settling time of the D/A converter. Figure 5 shows a pure sine function again. One can clearly discern spikes at the points where lots of input bits change concurrently, e.g., at half of the maximum voltage. I don’t know if this is caused by the outputs of the Arduino port being not perfectly synchronous, or if it is an inherent property of the converter. In practice it probably should not matter since there will be some kind of buffer/amplifier/offset compensation circuit that acts as a low-pass filter.
Figure 5 shows yet another oddity: From time to time, the Arduino seems to take a break (there is a plateau at about 75% of the width). This first showed up on the scope as a “ghost image,” i.e., there was a second, shifted version of the waveform on the screen. Fortunately, my Hameg scope has a builtin digital storage option, and after a couple of tries I could capture what is seen in Fig. 5. These plateaus are roughly 6-7 µs in length and turn up regularly every 1.1 ms or so. I checked that this is not something that occurs in between calls to the loop() function; it is really regular, and asynchronous to whatever else happens on the Arduino. I don’t know exactly what it is, but the frequency of these plateaus is suspiciously close to the frequency of the PWM outputs on pins 5 and 6 of the Uno (960 Hz), so it might have something to do with that.
You can download the code of the sketch here: dftsynth.c Remember that this is just a little test code. It only implements a pure sine transform. I am aware that the Arduino Uno with its limited RAM is not the ideal platform for actually producing audio output.
Please drop me a note if you have any comments or questions.
 LIKWID 5.2.1 is out! This bugfix release addresses a lot of small and not-so-small issues: