Intel’s Xeon Ice Lake CPU has finally caught up with AMD’s Rome in terms of full-chip peak performance and memory bandwidth. And, at long last, they have also fixed the Port 7 AGU problem I wrote about two years ago: Ice Lake now has two fully capable Store AGUs and an additional Store unit (although you can only do two stores concurrently if they go to the same cache line). There is one thing, however, that has appeared in recent years on ARM-based CPUs: automatic write-allocate elimination. We saw this for the first time on Cavium/Marvell’s ThunderX2 [1], although it was presumably present before on other ARM-based chips as well.
Basically what happens is that in situations where a write-allocate operation would be necessary, the hardware detects if the whole cache line is going to be overwritten. If it is, there’s no point in reading the cache line at all, and it can just be claimed in the cache right away. This saves 1/3 of the memory traffic on STREAM Copy, leading to a 50% performance gain if the saturated bandwidth doesn’t change. On the Fujitsu A64FX, this is not automatic but can be triggered by a special instruction, to the same effect [2]. Up to now, Intel followed a different path and supported nontemporal stores, which also avoid the write-allocate but in a different way: The cache line is stored “directly” to memory (actually through a write-combine buffer) so that it does not end up in the cache in the first place. Which strategy is better depends on the application: If the data is not needed soon, nontemporal stores may be better because the stored cache lines do not pollute the cache.
With Ice Lake, Intel provides for the first time a working mechanism for write-allocate evasion that’s similar to what the TX2 did. Intel calls it “SpecI2M,” and it’s described on slide 12 of a HotChips 2020 presentation:
SpecI2M optimization: Convert RFO to specI2M when memory subsystem is heavily loaded
- Reduces mem bandwidth demand on streaming WLs that do full cache line writes (25% efficiency increase)
This is quite cryptic, and there’s a lot of speculation about what SpecI2M actually does, but it’s actually simple to figure out. likwid-bench is the perfect tool for that. The copy_avx512 kernel provided with it is as simple as it gets:
vmovapd    zmm1, [STR0 + GPR1 * 8]
vmovapd    zmm2, [STR0 + GPR1 * 8 + 64]
vmovapd    zmm3, [STR0 + GPR1 * 8 + 128]
vmovapd    zmm4, [STR0 + GPR1 * 8 + 192]
vmovapd    [STR1 + GPR1 * 8]     , zmm1
vmovapd    [STR1 + GPR1 * 8 + 64], zmm2
vmovapd    [STR1 + GPR1 * 8 + 128], zmm3
vmovapd    [STR1 + GPR1 * 8 + 192], zmm4
I’ve omitted the loop mechanics here (and don’t worry about the base/index registers; the likwid-bench code generator substitutes them with the real names). This is the version with normal stores (vmovapd). The copy_mem_avx512 kernel uses nontemporal stores (vmovntpd) instead.
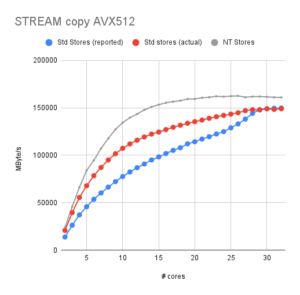 Figure 1: STREAM copy standard stores (blue, red) vs. nontemporal stores on Xeon Platinum 8358 |
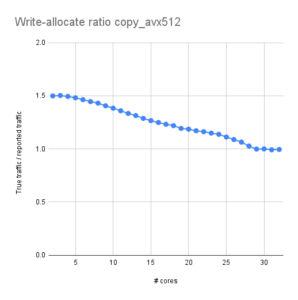 Figure 2: Ratio of actual vs. reported memory bandwidth |
I’ve run scaling tests with these kernels using a 2 GB working set on a Xeon Platinum 8358 (Ice Lake 32 cores, 2.6 GHz base frequency, SNC off, THP=always, numa_balancing=0):
$ likwid-bench -t copy_avx512 -W S0:2GB:${NUM_THREADS}:1:2
For standard stores, Figure 1 shows the reported bandwidth in blue and the actual bus bandwidth (measured with likwid-perfctr) in red. With a few cores, the actual bandwidth is exactly 50% larger than reported, as expected. This can be seen in Figure 2 where I plotted this ratio (basically red divided by blue in Fig. 1). However, the ratio gradually goes down as the number of cores goes up. It’s as if the write-allocate is avoided, but not based on the (sole) fact that full cache lines are overwritten but based on the actual bus utilization! At 29 cores and above, the ratio is finally down at 1.0, so the write-allocate is fully gone.
I don’t like that behavior.
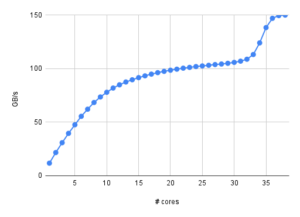
Figure 3: Reported bandwidth of the copy_avx512 kernel on the 38-core Ice Lake at KIT (HoreKa)
What I do like is a nice saturation curve like the one we see for NT stores (gray in Fig. 1). Not everyone can use NT stores, though; they only exist in SIMD variants (not quite, but for practical purposes they do), and you have to convince the compiler to use them unless you want to employ intrinsics or assembly. I looked for a way to switch off or alter the behavior of SpecI2M in the machine’s BIOS, but to no avail. [Update 2022: There is an MSR bit which can switch SpecI2M off or on; however, Intel does not disclose it publicly so we can’t include it in an open-source tool. Duh!]
Even worse, there are machines on which SpecI2M acts even more weirdly. The HoreKa cluster at KIT has 38-core Ice Lake Xeon Platinum 8368 CPUs. Figure 3 shows the reported bandwidth of the copy_avx512 loop vs. cores. Here, the write-allocate evasion mechanism seems to kick in only beyond 30 cores, when the memory bandwidth is already very close to saturation (and it has been this way at 20 cores already). This means that in order to get the full socket performance, I have to use (almost) all cores although I could get away with much fewer if only the SpecI2M were more aggressive. I wonder what speaks against letting it fire already from core 1. What harm could it do? And why can I not just turn it off?
To make sure that this is not just a property of the specific benchmark setup, here are some additional observations:
- The working set has no influence on the behavior. 10 GB instead of 2 GB make no difference whatsoever.
- It’s not specific to STREAM Copy but it shows with all streaming loops that have store misses (STREAM Triad, Schönauer Triad, etc.). Of course, the higher the load/store ratio, the smaller the effect.
- Turbo mode was switched off in these experiments, but it makes no difference if it’s on (apart from the higher single-core bandwidth, obviously).
- It’s not a specific quirk of likwid-bench; the same behavior can be observed with code that was compiled from a high-level language, such as Jan Eitzinger’s TheBandwidthBenchmark or the original McCalpin STREAM.
Although it makes teaching people about memory traffic harder, I still see SpecI2M as a step in the right direction. We certainly have to ask additional questions: At which cache level is the cache line claimed? Does the write-allocate evasion also work with more realistic code such as a stencil smoother? Great questions. Stay tuned.
[1] J. Hofmann, C. L. Alappat, G. Hager, D. Fey, and G. Wellein: Bridging the Architecture Gap: Abstracting Performance-Relevant Properties of Modern Server Processors. Supercomputing Frontiers and Innovations 7(2), 54-78, July 2020. Available with Open Access. DOI: 10.14529/jsfi200204.
[2] C. L. Alappat, N. Meyer, J. Laukemann, T. Gruber, G. Hager, G. Wellein, and T. Wettig: ECM modeling and performance tuning of SpMV and Lattice QCD on A64FX. Concurrency and Computation: Practice and Experience, e6512 (2021). Available with Open Access. DOI: 10.1002/cpe.6512.
 LIKWID 5.2.1 is out! This bugfix release addresses a lot of small and not-so-small issues: