Georg Hager's Blog

Random thoughts on High Performance Computing

Content

Himeno stencil benchmark: Roofline performance modeling and validation

[Update 17/11/29: Pointed out that the C version was modified from the original code – thanks Julian]

The Himeno benchmark [1] is a very popular code in the performance analysis and optimization community. Countless papers have been written that use it for performance assessment, prediction, optimization, comparisons, etc. Surprisingly, there is hardly a solid analysis of its data transfer properties. It’s a stencil code after all, and most of those can be easily analyzed.

The code

The OpenMP-parallel C version looks as shown below. I have made a slight change to the original code: The order of indices on the arrays a, b, and c hinders efficient SIMD vectorization, so I moved the short index to the first position. This also makes it equivalent to the Fortran version.

// all data structures hold single-precision values
for(n=0;n<nn;++n){
  gosa = 0.0;
  #pragma omp parallel for reduction(+:gosa) private(s0,ss,j,k)
  for(i=1 ; i<imax-1 ; ++i)
    for(j=1 ; j<jmax-1 ; ++j)
      for(k=1 ; k<kmax-1 ; ++k){
        // short index on a, b, c was moved up front
        s0 = a[0][i][j][k] * p[i+1][j ][k ]
           + a[1][i][j][k] * p[i ][j+1][k ]
           + a[2][i][j][k] * p[i ][j ][k+1]
           + b[0][i][j][k] * ( p[i+1][j+1][k ] - p[i+1][j-1][k ]
                             - p[i-1][j+1][k ] + p[i-1][j-1][k ] )
           + b[1][i][j][k] * ( p[i ][j+1][k+1] - p[i ][j-1][k+1]
                             - p[i ][j+1][k-1] + p[i ][j-1][k-1] )
           + b[2][i][j][k] * ( p[i+1][j ][k+1] - p[i-1][j ][k+1]
                             - p[i+1][j ][k-1] + p[i-1][j ][k-1] )
           + c[0][i][j][k] * p[i-1][j ][k ]
           + c[1][i][j][k] * p[i ][j-1][k ]
           + c[2][i][j][k] * p[i ][j ][k-1]
           + wrk1[i][j][k];
        ss = ( s0 * a[3][i][j][k] - p[i][j][k] ) * bnd[i][j][k];
        gosa = gosa + ss*ss;
        wrk2[i][j][k] = p[i][j][k] + omega * ss;
      }
  // copy-back loop ignored for analysis
  #pragma omp parallel for private(j,k)
  for(i=1 ; i<imax-1 ; ++i)
    for(j=1 ; j<jmax-1 ; ++j)
      for(k=1 ; k<kmax-1 ; ++k)
        p[i][j][k] = wrk2[i][j][k];
} /* end n loop */
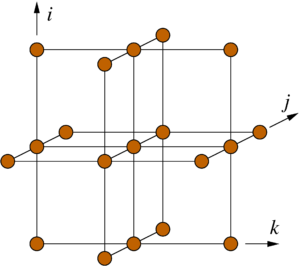
Himeno stancil

Figure 1: Structure of the 19-point stencil showing the data access pattern to the p[][][] array in the Himeno benchmark. The k index is the inner (fast) loop index here.

There is an outer iteration loop over n. The first (parallel) loop nest over i, j, and k updates the wrk2 array from the arrays a, b, c, wrk1, bnd, and p, of which only p has a stencil-like access pattern (see Fig. 1). All others are accessed in a consecutive, cacheline-friendly way. Since the coefficient arrays a, b, and c carry a fourth index in the first position, the row-major data layout of the C language leads to many concurrent data streams. We will see whether or not this impacts the performance of the code.

A second parallel loop nest copies the result in wrk2 back to the stencil array p. This second loop can be easily optimized away (how?), so we ignore it in the following; all analysis and performance numbers pertain to the first loop only.

Amount of work

There are 14 floating-point additions, 7 subtractions, and 13 multiplications in the loop body. Hence, one lattice site update (LUP) amounts to 34 flops.

Data transfers and best-case code balance

For this analysis the working set shall be larger than any cache. It is straightforward to calculate a lower limit for the data transfers if we assume perfect spatial and temporal locality for all data accesses within one update sweep: All arrays except wrk2 must be read at least once, and wrk2 must be written. This leads to (13+1) single-precision floating-point numbers being transferred between the core(s) and main memory. The best-case code balance is thus Bc = 1.65 byte/flop = 56 byte/LUP. If the architecture has a write-back cache, an additional write-allocate transfer must be accounted for if it cannot be avoided (e.g., by nontemporal stores). In this case the best-case code balance is Bc = 1.76 byte/flop = 60 byte/LUP.

Considering that even the most balanced machines available today are not able to feed such a hunger for data (e.g., the new NEC-SX Aurora TSUBASA vector engine with 0.5 byte/flop), we know that this code will be memory bound. If the memory bandwidth can be saturated, the upper performance limit is the memory bandwidth divided by the code balance.

Continue reading

Open Source Architecture Code Analyzer (OSACA) has been released

The Open Source Architecture Code Analyzer (OSACA) is a tool that can analyze assembly or machine code and produce a best-case (throughput-limited) runtime prediction assuming that the data is in the L1 cache. Such a tool is sorely needed for processor architectures other than Intel’s. Intel provides the Intel Architecture Code Analyzer (IACA) for free, but it is not open source and its future development path is uclear.

Why such a tool? Analytic performance models, such as the ECM model, depend on an accurate assessment of in-core execution performance. You can either do that manually by code (source or assembly) inspection, or you can use a tool that knows the instruction set and the limitations of a particular microarchitecture. The data flow analysis must be done by someone else – again, it’s either your brain or, e.g., our Kerncraft tool.

Jan Laukemann, our bachelor’s candidate, has taken on the tremendous task of developing the initial version of an IACA replacement, and OSACA is the result. It is downloadable from github: https://github.com/RRZE-HPC/osaca. We haven’t even bothered to give it a version number yet, so this is definitely in alpha stage, but it is usable and can do some things that IACA can’t, such as, e.g., analyze non-compiled assembly code or extend its own database with new instructions.

Feedback is encouraged and welcome.


Why IPC (or CPI) is not a good performance metric

Instructions per cycle (IPC) or its reciprocal CPI (cycles per instruction) are the processor architect’s dearest metrics. They quantify how effectively a core can execute instructions. If that is what you care about, it may do the job, and there are many cases where it does: If you have a pile of codes from all sorts of application fields, and those codes don’t really change (meaning that the binary representation is always the same) as you go from one architecture to another, IPC is indeed a good performance metric. When running the same binary on different CPUs, higher IPC means higher performance.

In high performance computing, however, this is not what we do. Once a new architecture comes out, we at least recompile our codes (hoping that the compiler knows something about the gory details of that new chip that it can use to some advantage). Sometimes we do architecture-specific optimizations, insert directives, change blocking factors to adapt to cache sizes, etc. This breaks the “same binary” condition above, and who knows how many instructions are needed to do the same thing using two different instruction sets or two different low-level code transformations?

SIMD (Single Instruction Multiple Data) is a perfect example. Consider this very simple double-precision STREAM ADD code:

#pragma omp parallel for
for(int i=0; i<N; ++i)
  c[i] = a[i] + b[i];

To keep things simple we will assume that the working set is too large to fit into any cache, so the performance will be memory bound. A modern Intel Skylake CPU with six DDR4-2666 memory channels can deliver about 110 Gbyte/s of memory bandwidth, so at a code balance of Bc=32 byte/flop (assuming nontemporal stores canot be used) the maximum achievable performance for this loop is about \frac{110\,\text{Gbyte/s}}{32\,\text{byte/flop}} \approx 3.4\,\text{Gflop/s}~. At this performance, what is the IPC value? That depends on how many instructions are executed in the loop body, and of which type they are. Let us distinguish the two corner cases:

  1. Fully vectorized AVX-512 code with extra four-way unrolling. The loop body consists of eight LOADs, four STOREs, and four ADDs (I am counting micro-ops here; the x86 ADDs may carry a memory argument), plus the loop mechanics (increment, compare, conditional jump). These are 19 instructions for 32 flops, so at 3.4 Gflop/s and a clock frequency of 2 GHz we have \text{IPC}_\mathrm{AVX512} = \frac{3.4\times 10^9\,\text{flop/s}\times\frac{19}{32}\text{instr.}/\text{flop}}{2.0\times 10^9\,\text{cy/s}}\approx 1.0\,\text{instr.}/\text{cy}~. Note that this number does not depend on the number of cores we use as long as the memory bandwidth is saturated. The IPC per core is, of course, this value divided by the number of cores that participate in the calculation.
  2. Scalar code without any additional unrolling. In this case we have two LOADs, one STORE, one ADD, and the three loop instructions, which boils down to 7 instructions for 1 flop. At saturation we thus get \text{IPC}_\mathrm{scalar} = \frac{3.4\times 10^9\,\text{flop/s}\times 7\,\text{instr.}/\text{flop}}{2.0\times 10^9\,\text{cy/s}}\approx 12\,\text{instr.}/\text{cy}~. It’s not just eight times the result above because the loop mechanics has much more impact when the loop is not unrolled.

The two codes have the same performance in the saturated case, but the scalar code has a much “better” (i.e., higher) IPC. It’s not always this pronounced, but one can easily imagine the IPC ratio going in both directions when comparing “baseline” with “optimized” code if there is no concept of what “good performance” means. In the example above, the roofline model provided a clear guideline. If you don’t have that and rely on IPC alone instead, any comparison is useless.

Vectorization is just one of many things a compiler can do to the code, and which may change the IPC value in an uncontrolled way that has nothing to do with performance. Although this topic pops up time and again in many of your tutorials, an article in the inaugural issue of the ACM Transactions on Parallel Computing has raised my interest [1]. The paper is actually about using data structure metrics for performance optimization, but one of their examples made me scratch my head:

// fused loop
#pragma omp parallel for
for(i=0; i<N ; ++i)
  w[i] = a1[i]+a2[i]+a3[i]+a4[i]+a5[i]+a6[i]+a7[i]+a8[i]+a9[i]+a10[i];

(I have substituted the generic parallelization directives in the paper by OpenMP and translated the code to C). This loop, the authors claim, has a problem because of the many concurrent read streams (11 actually, counting the write-allocate on w[]) the architecture must handle. It would thus be better to split it:

// split loop
#pragma omp parallel
{
#pragma omp for
  for(i=0; i<N ; ++i)
    w[i] = a1[i]+a2[i]+a3[i]+a4[i]+a5[i];
#pragma omp for 
  for(i=0; i<N ; ++i)
    w[i] += a6[i]+a7[i]+a8[i]+a9[i]+a10[i];
}

Indeed, loop splitting (just like the reverse, loop fusion) is a standard technique. It reduces the intricacy of loop code, avoiding, e.g., register spills, compiler confusion, and, of course, too many concurrent streams. The paper then shows CPI data for the loop running with an in-memory working set on an eight-core Sandy Bridge processor, observing a >2x reduction in CPI (i.e., a >2x increase in IPC) for the above case when the loop is split. Runtime or “work per time” data is missing, i.e., the claim about splitting being good for performance rests on the CPI data alone. I could not reproduce their experimental setup completely because I don’t have a working Intel compiler 11.1 any more, but this does not really change the message: IPC is not a performance metric.

What I did was run the codes on an Ivy Bridge CPU (10 cores, but otherwise quite similar to Sandy Bridge; fixed 2.2 GHz clock speed) using a range of compilers (Intel 12.0 to 17.0). This is what my code prints out (download see below [2]):

$ likwid-pin -q -c S0:0-9 ./SPLITME.exe
Split performance: 375 MIt/s, BW: 41.97 GB/s
Fused performance: 438 MIt/s, BW: 42.08 GB/s

The bandwidth numbers are calculated using the known code balance of both loops (96 byte/iteration and 112 byte/iteration, respectively). likwid-perfctr with the MEM group reports something very close to this. LIKWID code markers are in the code so that the two regions can be measured separately. The result did not change much between compilers: As expected, the performance is limited by the main memory bandwidth (about 42 Gbyte/s in my case) for both versions, and the performance in Gflop/s was better for the fused version by about 17% (16.7% are expected because of the increase in code balance when splitting the loop). The CPI (as measured with likwid-perfctr) was even slightly larger for the split loop version (6.7 vs. 6.2); although it has slightly more instructions (one LOAD and one STORE on the left-hand side), the performance loss is more significant. I have also repeated the experiment on an older six-core Westmere EP processor, with identical results (of course, the actual numbers differ: it has less than half the memory bandwidth of the IVB and only SSE4.2 vector extensions).

I am not saying that an excessive number of streams may not be detrimental to performance; it actually is, and this is well known in the Lattice-Boltzmann community [3]. My only point here is that CPI (or IPC) is neither a useful nor a reliable performance metric. Performance is work divided by wall-clock time, and “number of instructions” is no good for quantifying “work” except in very narrow areas. Another striking example is the observed CPI in load-imbalanced OpenMP codes. If you want to learn more about this, come visit one of our Node-Level Performance Engineering tutorials.


[1] A. Rane and J. Browne: Enhancing Performance Optimization of Multicore/Multichip Nodes with Data Structure Metrics. ACM Trans. Parallel Comput. 1(1), 3:1-3:20 (2014). DOI: 10.1145/2588788

[2] Download: splitme.tar.gz

[3] M. Wittmann, G. Hager, T. Zeiser, J. Treibig, and G. Wellein: Chip-level and multi-node analysis of energy-optimized lattice-Boltzmann CFD simulations. Concurrency and Computation: Practice and Experience 28(7), 2295-2315 (2015). DOI: 10.1002/cpe.3489 Preprint: arXiv:1304.7664