Georg Hager's Blog

Random thoughts on High Performance Computing

Content

Intel’s port 7 AGU blunder

Everyone’s got their pet peeves: For Poempelfox it’s Schiphol Airport, for Andreas Stiller it’s the infamous A20 gate. Compared to those glorious fails, my favorite tech blunder is a rather measly one, and it may not be relevant to many users in practice. However, it’s not so much the importance of it but the total mystery of how it came to happen. So here’s the thing.

Loads, stores, and AGUs

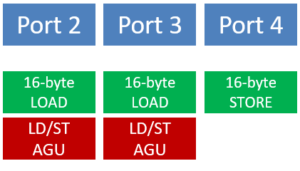
Sandy Bridge and Ivy Bridge LOAD and STORE units, AGUs, and their respective ports.

The Intel Sandy Bridge and Ivy Bridge architectures have six execution ports, two of which (#2 & #3) feed one LOAD pipeline each and one (#4) feeds a STORE pipe. These units are capable of transferring 16 bytes of data per cycle each. With AVX code, the core is thus able to sustain one full-width 32-byte LOAD (in two adjacent 16-byte chunks) and one half of a 32-byte STORE per cycle. But the LOAD and STORE ports are not the only thing that’s needed to execute these instructions – the core must also generate the corresponding memory addresses, which can be rather complicated. In a LOAD instruction like:

vmovupd ymm0, [rdx+rsi*8+32]

the memory address calculation involves two integer add operations and a shift. It is the task of the address generation units (AGUs) to do this. Each of ports 2 and 3 serves an AGU in addition to the LOAD unit, so the core can generate two addresses per cycle – more than enough to sustain the maximum LOAD and STORE throughput with AVX.

The peculiar configuration of LOAD and STORE units and AGUs causes some strange effects. For instance, if we execute the Schönauer vector triad: Continue reading
Node-Level Performance Engineering Course at LRZ

We proudly present a retake of our PRACE course on “Node-Level Performance Engineering” on December 3-4, 2019 at LRZ Garching.

This course covers performance engineering approaches on the compute node level. Even application developers who are fluent in OpenMP and MPI often lack a good grasp of how much performance could at best be achieved by their code. This is because parallelism takes us only half the way to good performance. Even worse, slow serial code tends to scale very well, hiding the fact that resources are wasted. This course conveys the required knowledge to develop a thorough understanding of the interactions between software and hardware. This process must start at the core, socket, and node level, where the code gets executed that does the actual computational work. We introduce the basic architectural features and bottlenecks of modern processors and compute nodes. Pipelining, SIMD, superscalarity, caches, memory interfaces, ccNUMA, etc., are covered. A cornerstone of node-level performance analysis is the Roofline model, which is introduced in due detail and applied to various examples from computational science. We also show how simple software tools can be used to acquire knowledge about the system, run code in a reproducible way, and validate hypotheses about resource consumption. Finally, once the architectural requirements of a code are understood and correlated with performance measurements, the potential benefit of code changes can often be predicted, replacing hope-for-the-best optimizations by a scientific process.

This is a two-day course with demos. It is provided free of charge to members of European research institutions and universities.

 Date: Tuesday, Dec 3, 2019 09:00 – 17:00
Wednesday, Dec 4, 2019 09:00 – 17:00
Location: LRZ Building, University campus Garching, near Munich, Hörsaal H.E.009 (Lecture hall)
Course webpage with detailed agenda: https://events.prace-ri.eu/event/901/
Registration: Via https://events.prace-ri.eu/event/901/registrations/633/

PMBS19 Workshop Best Late-Breaking Paper Award

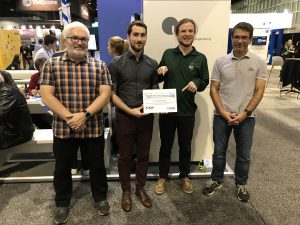
The authors proudly presenting the award at the Bavarian Supercomputing Alliance booth at SC19.

Our paper “Automatic Throughput and Critical Path Analysis of x86 and ARM Assembly Kernels” has just won the “Best Late-Breaking Paper Award” at the 10th Workshop on Performance Modeling, Benchmarking and Simulation of High Performance Computer Systems (PMBS19), a renowned workshop co-located with the SC19 conference. The lead author, our master student Jan Laukemann, presented his work on a new version of the OSACA tool (Open-Source Architecture Code Analyzer), which now supports throughput, critical path, and loop-carried dependency analysis for assembly loop kernels on x86 and ARM architectures. It is thus a critical component for ECM and Roofline modeling and can be used as a more capable substitute for Intel’s discontinued IACA tool.

LIKWID 5.0 is here

LIKWID stickers

Laptop decorations available at SC19!

Just in time for SC19, version 5 of our popular LIKWID tool suite has been released. There are tons of new developments in there; these are the most important ones:

  • Support for ARM architectures, especially for Marvell Thunder X2
  • Support for IBM POWER architectures (POWER8 and POWER9)
  • Support for AMD Zen2 and for data fabric counters of the AMD Zen microarchitecture
  • Support for Nvidia GPU monitoring (with NvMarkerAPI)
  • New clock frequency backend (with less overhead)
  • Generation of benchmarks for likwid-bench on-the-fly from ptt files
  • Integration of GOTCHA for hooking into client applications at runtime
  • Thread-local initialization of streams for likwid-bench
  • Enhanced support for SLURM with likwid-mpirun
  • New MPI and Hybrid pinning features for likwid-mpirun
  • JSON output filter file (use -o output.json)
  • Updated quick reference sheet with all the new options

The full list is available at the github release page. And if you need something really cool to cover that empty spot on your laptop lid, we’ll have LIKWID stickers available during our SC19 tutorial “Node-Level Performance Engineering” and at the Bavarian Supercomputing booth (#2063).

Direct download from FAU FTP

LIKWID documentation Wiki

Github project