At SC14 in New Orleans we (Jan Treibig and I, with help by Thomas William from TU Dresden) conducted, for the first time, a BoF with the title “Code Optimization War Stories.” Its purpose was to share and discuss several interesting and (hopefully) surprising ventures in code optimization. Despite the fact that we were accused by an anonymous reviewer of using “sexist language” that was “off-putting and not welcoming” (the offending terms in our proposal being “man-hours” and “war stories”), the BoF sparked significant interest with some 60 attendees. In parallel to the talks and discussions, participants were asked to fill out a survey about several aspects of their daily work, which programming languages and programming models they use, how they approach program optimization, whether they use tools, etc. The results are now available after I have finally gotten around to typing in the answers given on the paper version; fortunately, more than half of the people went for the online version. Overall we had 29 responses. Download the condensed results here: CodeOptimizationWarStories_SurveyResults.pdf
The results are, in my opinion, partly surprising and partly expected. Note that there is an inherent bias here since the audience was composed of people specifically interested in code optimization (according to the first survey question, they were mostly developers and domain scientists); believe it or not, such a a crowd is by no means a representative sample of all attendees of SC14, let alone the whole HPC community. The following observations should thus be taken with a grain of salt. Or two.
Management summary: In short, people mostly write OpenMP and MPI-parallel programs in C, C++, or Fortran. The awareness of SIMD is surprisingly strong, which is probably why single-core optimization is almost as popular as socket, node, or massively parallel tuning. x86 is the dominant architecture, time to solution is the most important target metric, and hardly anyone cares about power dissipation. The most popular tools are the simple ones: gprof and friends mostly, supported by some hardware metrics. Among those, cache misses are still everybody’s darling. Among the few who use performance models at all, it’s almost exclusively Roofline.

What is the programming language that you mostly deal with when optimizing code?
Here are the details:
- Which area of science does the code typically come from that you work on? Physics leads the pack (59%) here, followed by maths, CFD, and chemistry.
- Programming languages. Fortran is far from dead: 52% answered “Fortran 90/95” when asked for the programming languages they typically deal with. Even Fortran 77 is still in the game with 24%. However, C++98 (69%) and C (66%) are clearly in the lead. For me it was a little surprising that C++11 almost matches Fortran at 45% already. However, this popularity is not caused by the new threading features (see next item).
- Typical parallel programming models. Most people unsurprisingly answered “OpenMP” or “MPI” (both 76%). The unexpected (at least in my view) runner-up with 69% is SIMD, which is good since it finally seems to get the attention it deserves! CUDA landed at a respectable 31%, and C++11 threads trail behind at 14%, beaten even by the good old POSIX threads (17%). The PGAS pack (GASPI, Global Arrays, Co-Array Fortran, UPC) hits rock bottom, being less popular than Java threads and Cilk (7% and 10%, respectively). OpenCL struggles at a mere 14%. If it weren’t for this “grain of salt” thing (see above), one might be tempted to spot a few sinking ships here…
- Do you optimize for single core, socket/node, or highly parallel? Code optimization efforts were almost unanimously reported to revolve around the highly parallel (69%) or socket/node level (76%), but 52% also care about single-core issues. The latter does not quite match the 69% who say they write SIMD-parallel code, which leaves some room for speculation. Anyway it is good to see that some people still don’t lose sight of the single core even in a highly parallel world.
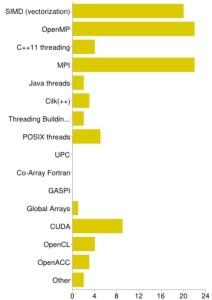
What is the parallel programming model that you mostly deal with when optimizing code?
- Computer architectures. x86-based systems are clearly in the lead (90%) in terms of target architectures, because there’s hardly anything left. IBM Blue Gene (7%) and Cray MPPs (3%) came out very low, which is entirely expected: although big machines do get a lot of media attention, most people (have to) deal with the commodity stuff under their desks and in local computing centers. Xeon Phi (34%) and Nvidia GPUs (31%) go almost head to head; a clear success for Intel’s aggressive marketing strategy.
- Typical optimization target metrics. This was a tricky one since many metrics overlap significantly, and it is not possible to use one and not touch the other. Still it is satisfying that low time to solution comes out first (72%), followed by speedup (59%) and high work/time ratio (52%). It would be interesting to analyze whether there is a correlation or an anti-correlation between these answers across the attendees; maybe I should have added “-O0” as another optimization option in the next question 😉 Low power and/or low energy, although being “pivotal today” (if you believe the umpteenth research paper on the subject) are just slightly above radar level. Probably there’s just not enough pressure from computing centers, or probably there weren’t enough attendees from countries where electric energy isn’t almost free, who knows?
- Optimization strategies. No surprises here: 90% try to find a good choice of compiler options, and standard strategies like fixing load imbalance, doing loop transformations, making the compiler understand the code better, and optimizing communication patterns and volume, etc., are all quite popular. Autotuning methods mark the low end of the spectrum. It seems that the state-of-the-art autotuning frameworks haven’t made it into the mainstream yet.
- Approaches for saving energy (or related). The very few people who actually did some energy-related optimization have understood that good performance is the lowest-order effect in getting good energy efficiency. Hardly anyone tried voltage and/or frequency scaling for saving energy. This may have to do with the fact that few centers allow users to play with these parameters, or provide well-defined user interfaces. Btw, since release 3.1.2 of the LIKWID tools we support
likwid-setFrequencies, a simple program which allows you to set the CPU clock speed from the shell. -
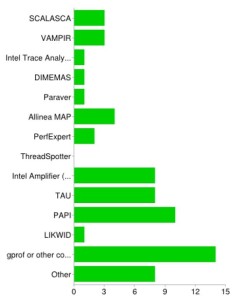
If you have used performance tools, which ones?
Popular performance tools. 76% answered that they had used some tool for optimizing application code at least once. However, although optimizing highly parallel applications is quite popular (see above), the typical parallel tools such as Vampir or Scalasca are less fashionable than expected (both 10%, even behind Allinea MAP), and TAU is only used by 28%. On the other hand, good old gprof or similar compiler-based facilities still seem to be very important (48%). There were some popular tools I hadn’t thought of (unforgivably) when putting together the survey, and they ended up in the “other” category: Linux perf, valgrind, HPC Toolkit. The whole picture shows that people do deal with single-thread/node issues a lot. LIKWID deserves a little more attention, though 🙂
- What are the performance tools used for? I put in “producing colorful graphs” as a fun option, but 21% actually selected it! Amazing, they must have read my “Show data! Plenty.” blog post. Joke aside, 76% and 66%, respectively, reported that they use tools for identifying bottlenecks and initial code assessment. Only very few employ tools for validating performance models, which is sad but will hopefully change in the future.
- What are the most popular hardware performance events? Ahead even of clock cycles (31%) and Flops (41%), cache misses are the all-time winner with 55%. This is not unexpected, cache misses being the black plague of HPC and all. Again, somewhat surprisingly, SIMD-related metrics are strong with 28%. Hardly anyone looks at cross-NUMA domain traffic, and literally nobody uses hardware performance counters to study code balance (inverse computational intensity).
- Do you use performance models in your optimization efforts? The previous two questions already gave a hint towards the outcome of this one: 41% answered “No,” 21% answered “Yes,” and 24% chose “What is this performance modeling stuff anyway?” Way to go.
- Which performance model(s) do you use? Among those who do use performance models, Roofline is (expectedly) most popular by far, although there’s not much statistics with six voters.
- The remaining questions have dealt with how useful it would be to have a dedicated “code optimization community” (whatever that means in practice), which received almost unanimous approval, and how attendees rated the BoF as a whole. 62% want to see more of this stuff in the future, which we interpret as encouraging. Two people even considered it the “best BoF ever.” So there.


As I wrote above, there is a strong bias in these answers, and the results are clearly not representative of the HPC community. But if we accept that those who attended the BoF are really interested in optimizing application code, the conclusion must be that recent developments in tools and models trickle into this community at a very slow rate.