The Marker API of likwid-perfctr lets you count hardware events on your CPU core(s) separately for different execution regions. E.g., in order to count events for a loop, you would use it like this:
#include <likwid.h>

int main(...) {
  // always required once
  LIKWID_MARKER_INIT;
  // ...
  LIKWID_MARKER_START("loop");
  for(int i=0; i<n; ++i) {
    do_some_work();
  }
  LIKWID_MARKER_STOP("loop");
  // ...
  LIKWID_MARKER_CLOSE;
  return 0;
}
An arbitrary number of regions is allowed, and you can use the LIKWID_MARKER_START and LIKWID_MARKER_STOP macros in parallel regions to get per-core readings. The events to be counted are configured on the likwid-perfctr command line. As with anything that is not part of the actual work in a code, one may ask about the cost of the marker API calls. Do they impact the runtime of the code? Does the number of cores play a role?
I ran benchmark tests on a dual-Xeon “Broadwell” E5-2697 v4 (2.3 GHz) node with 18 cores per socket in non-CoD mode. The OS was Ubuntu 16.04.4 LTS with kernel 4.4.0-119-generic and the latest patches. The clock speed (core and Uncore) was set to 2.3 GHz.
This is the benchmark code (slightly simplified – see below for a download link):
LIKWID_MARKER_INIT;
#pragma omp parallel
{
 LIKWID_MARKER_REGISTER("iter");
}

NITER=1;
do {
  // time measurement
  timing(&wct_start);

  #pragma omp parallel private(k)
  {
    for(k=0; k<NITER; ++k) {
      LIKWID_MARKER_START("iter");

      if(divsleep(200000) < 0.0)
        exit(1);

      LIKWID_MARKER_STOP("iter");
    }
  }
  timing(&wct_end);
  NITER = NITER*2;
} while (wct_end-wct_start < 0.2);

NITER = NITER/2;

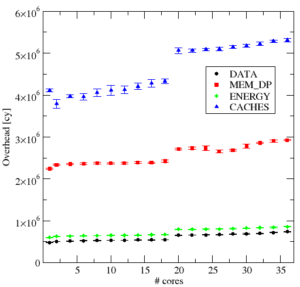
Figure 1: LIKWID marker overhead vs. number of cores (compact pinning, physical cores only) for four different metric groups on the 36-core Broadwell system (LIKWID 4.3.2).
The divsleep() function performs the indicated number of floating-point divides and is a reliable busy-waiting in-core routine that always takes the same amount of time (about 4 cycles per scalar divide on a Broadwell CPU, 7 on an Ivy Bridge). Running the benchmark without markers activated (i.e., without the -m option to likwid-perfctr) , it reports exactly the expected number of cycles (800k on BDW, 1.4 million on IVY). The marker calls return immediately in this case, and of course the runtime does not depend on the number of OpenMP threads. The macro LIKWID_MARKER_REGISTER avoids excessive overhead when LIKWID_MARKER_START is called for the first time. In our case it’s not strictly necessary since the actual measurement is taken multiple times with increasing NITER anyway, but in general it’s a good idea to call LIKWID_MARKER_REGISTER for every marker region that is used later in the code.
With markers activated, the overhead becomes visible. I subtracted the constant runtime of the delay routine from the measured runtime. The result has a slight statistical variation, but the chosen runtime of at least 0.2 seconds makes the measurements quite reproducible.
Figure 1 shows the resulting overhead cycles on the Broadwell system versus the number of threads (compact pinning, physical cores only) with the current version of LIKWID (4.3.2). Out of the considerable number of available metric groups in LIKWID, I chose four: DATA (core-only, loads/stores), CACHES (full account of cacheline traffic through the memory hierarchy), ENERGY (RAPL measurements of energy consumption), and MEM_DP (combination of flops, memory traffic, and energy). These are the relevant observations:
- The overhead depends weakly on the number of cores. There is a noticeable jump when the second socket is involved, but the overhead cycles always stay in the same ballpark.
- The overhead depends strongly on the events that are counted. Roughly speaking, “the more events, the more expensive.” CACHES is most toxic in this respect, with over 5 million cycles on the whole node.
- The marker overhead is much larger than typical OpenMP overheads (which are around a couple of 1000s cycles for barriers, for instance, when using the Intel OpenMP runtime).
Since starting and stopping counters requires access to the MSR registers and/or PCI devices (for Uncore events), do the recent microcode and kernel patches to mitigate the “Meltdown” hardware vulnerability scenario worsen the overhead? All our test cluster machines have the latest patches installed, but we have kept one node of our Ivy-Bridge-based Emmy cluster in a non-patched state. Emmy has Intel Xeon “Ivy Bridge” E5-2660 v2 CPUs at 2.2 GHz and runs CentOS with kernel 3.10.0-693.21.1.el7.x86_64; on the non-patched node we run 3.10.0-693.11.6.el7.x86_64. There are also no microcode patches on the latter, so it is in the state it was in before Meltdown was discovered. We don’t have the latest LIKWID version on Emmy yet, but 4.3.1 is available, and there haven’t been any changes recently that would influence the marker overhead.
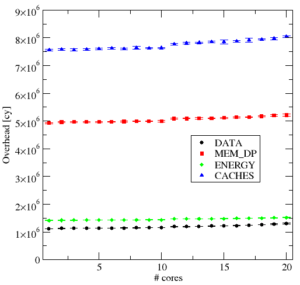
Figure 2 shows the results for the same experiment as above on a patched node. The general observations are the same, even the relative overhead between different metric groups is comparable, and we are also in the range between 1 and 5 million cycles per start/stop pair.
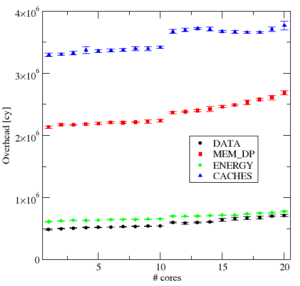
Figure 3 shows the results on the non-patched node. The overhead is roughly a factor of two smaller. So, while the Meltdown patches haven’t let the marker overhead grow without bounds, they still caused a significant increase.
A couple of million cycles may be insignificant for many applications, but this is in the millisecond range – knowing the cost enables us to calculate how fine-grained the marker regions may become before impacting the code performance.
Benchmark code for download: likwid_marker_overhead.zip. The makefile assumes that the variables LIKWID_LIB and LIKWID_INC are set appropriately, which is done automatically by our modules system. Adapt as needed.

