Georg Hager's Blog

Random thoughts on High Performance Computing

Content

Stepanov test faster than light?

If you program in C++ and care about performance, you have probably heard about the Stepanov abstraction benchmark [1]. It is a simple sum reduction that adds 2000 double-precision floating-point numbers using 13 code variants. The variants are successively harder to see through by the compiler because they add layers upon layers of abstractions. The first variant (i.e., the baseline) is plain C code and looks like this:

// original source of baseline sum reduction
void test0(double* first, double* last) {
  start_timer();
  for(int i = 0; i < iterations; ++i) {
    double result = 0;
    for (int n = 0; n < last - first; ++n) result += first[n];
    check(result);
  }
  result_times[current_test++] = timer();
}

It is quite easy to figure out how fast this code can possibly run on a modern CPU core. There is one LOAD and one ADD in the inner loop, and there is a loop-carried dependency due to the single accumulation variable result. If the compiler adheres to the language standard it cannot reorder the operations, i.e., modulo variable expansion to overlap the stalls in the ADD pipeline is ruled out. Thus, on a decent processor such as, e.g., a moderately modern Intel design, each iteration will take as many cycles as there are stages in the ADD pipeline. All current Intel CPUs have an ADD pipeline of depth three, so the expected performance will be one third of the clock speed in GFlop/s.

If we allow some deviation from the language standard, especially unsafe math optimizations, then the performance may be much higher, though. Modulo variable expansion (unrolling the loop by at least three and using three different result variables) can overlap several dependency chains and fill the bubbles in the ADD pipelines if no other bottlenecks show up. Since modern Intel CPUs can do at least one LOAD per cycle, this will boost the performance to one ADD per cycle. On top of that, the compiler can do another modulo variable expansion for SIMD vectorization. E.g., with AVX four partial results can be computed in parallel in a 32-byte register. This gives us another factor of four.

Original baseline assembly code
-O3 -march=native -O3 -ffast-math -march=native
  vxorpd %xmm0, %xmm0, %xmm0
.L17:
  vaddsd (%rax), %xmm0, %xmm0
  addq $8, %rax
  cmpq %rbx, %rax
  jne .L17
  vxorpd %xmm1, %xmm1, %xmm1
.L26:
  addq $1, %rcx
  vaddpd (%rsi), %ymm1, %ymm1
  addq $32, %rsi
  cmpq %rcx, %r13
  ja .L26
  vhaddpd %ymm1, %ymm1, %ymm1
  vperm2f128 $1, %ymm1, %ymm1, %ymm3
  vaddpd %ymm3, %ymm1, %ymm1
  vaddsd %xmm1, %xmm0, %xmm0

Now let us put these models to the test. We use an Intel Xeon E5-2660v2 “Ivy Bridge” running at a fixed clock speed of 2.2 GHz (later models can run faster than four flops per cycle due to their two FMA units). On this CPU the Stepanov peak performance is 8.8 GFlop/s for the optimal code, 2.93 GFlop/s with vectorization but no further unrolling, 2.2 GFlop/s with (at least three-way) modulo unrolling but no SIMD, and 733 MFlop/s for standard-compliant code. The GCC 6.1.0 was used for all tests, and only the baseline (i.e., C) version was run.
Manual assembly code inspection shows that the GCC compiler does not vectorize or unroll the loop unless -ffast-math allows reordering of arithmetic expressions. Even in this case only SIMD vectorization is done but no further modulo unrolling, which means that the 3-stage ADD pipeline is the principal bottleneck in both cases. The (somewhat cleaned) assembly code of the inner loop for both versions is shown in the first table. No surprises here; the vectorized version needs a horizontal reduction across the ymm1 register after the main loop, of course (last four instructions).

Original baseline code performance
g++ options Measured [MFlop/s] Expected [MFlop/s]
-O3 -march=native 737.46 733.33
-O3 -ffast-math -march=native 2975.2 2933.3

In defiance of my usual rant I give the performance measurements with five significant digits; you will see why in a moment. I also selected the fastest among several measurements, because we want to compare the highest measured performance with the theoretically achievable performance. Statistical variations do not matter here. The performance values are quite close to the theoretical values, but there is a very slight deviation of 1.3% and 0.5%, respectively. In performance modeling at large, such a good coincidence of measurement and model would be considered a success. However, the circumstances are different here. The theoretical performance numbers are absolute upper limits (think “Roofline”)! The ADD pipeline depth is not 2.96 cycles but 3 cycles after all. So why is the baseline version of the Stepanov test faster than light? Can the Intel CPU by some secret magic defy the laws of physics? Is the compiler smarter than we think?

A first guess in such cases is usually “measuring error,” but this was ruled out: The clock speed was measured by likwid-perfctr to be within 2.2 GHz with very high precision, and longer measurement times (by increasing the number of outer iterations) do not change anything. Since the assembly code looks reasonable, the only conclusion left is that the dependency chain on the target register, which is completely intact in the inner loop, gets interrupted between iterations of the outer loop because the register is assigned a new value. The next run of the inner loop can thus start already before the previous run has ended, leading to overlap. A simple test supports this assumption: If we cut the array size in half, the relative deviation doubles. If we reduce it to 500, the deviation doubles again. This strongly indicates an overlap effect (absolute runtime reduction) that is independent of the actual loop size.

In order to get a benchmark that stays within the light speed limit, we modify the code so that the result is only initialized once, before the outer loop:

// modified code with intact (?) dependency chain
void test0(double* first, double* last) {
  start_timer();
  double result = 0; // moved outside
  for(int i = 0; i < iterations; ++i) {
    for (int n = 0; n < last - first; ++n) result += first[n];
    if(result<0.) check(result);
  }
  result_times[current_test++] = timer();
}

The result check is masked out since it would fail now, and the branch due to the if condition can be predicted with 100% accuracy. As expected, the performance of the non-SIMD code now falls below the theoretical maximum. However, the SIMD code is still faster than light.

Modified baseline code performance
g++ options Measured [MFlop/s] Expected [MFlop/s]
-O3 -march=native 733.14 733.33
-O3 -ffast-math -march=native 2985.1 2933.3

How is this possible? Well, the dependency chain is doomed already once SIMD vectorization is done, and the assembly code of the modified version is very similar to the original one. The horizontal sum over the ymm1 register puts the final result into the lowest slot of ymm0, so that ymm1 can be initialized with zero for another run of the inner loop. From a dependencies point of view there is no difference between the two versions. Accumulation into another register is ruled out for the standard-conforming code because it would alter the order of operations. Once this requirement has been dropped, the compiler is free to choose any order. This is why the -ffast-math option makes such a difference: Only the standard-conforming code  is required to maintain an unbroken dependency chain.

Of course, if the g++ compiler had the guts to add another layer of modulo unrolling on top of SIMD (this is what the Intel V16 compiler does here), the theoretical performance limit would be ADD peak (four additions per cycle, or 8.8 GFlop/s). Such a code must of course stay within the limit, and indeed the best Intel-compiled code ends up at 93% of peak.

Note that this is all not meant to be a criticism of the abstraction benchmark; I refuse to embark on a discussion of religious dimensions. It just happened to be the version of the sum reduction I have investigated closely enough to note a performance level that is 1.3% faster than “the speed of light.”

[1] http://www.open-std.org/jtc1/sc22/wg21/docs/D_3.cpp


Energy vs. performance: Introducing the Z-plot

Figure 1: Z-plot

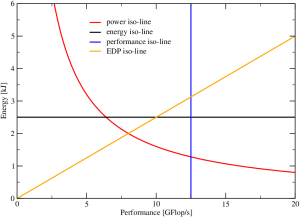
Figure 1: Z-plot with relevant iso-lines

Energy consumption and power dissipation have become the latest craze in HPC, for several reasons. Unfortunately there is also a lot of confusion about the interplay of performance and power. Thomas Zeiser from the RRZE HPC group has come up with an interesting way of visualizing energy-performance data on the CPU socket level that makes it easier to reason about energy consumption. The Z-plot shows dissipated energy to solution (i.e., how much energy is spent for solving a given problem) versus the program’s performance, which can be quantified by any appropriate metric that is inversely proportional to the runtime. Figure 1 shows that, if we always solve the same problem, most of the interesting quantities one would like to study in the Z-plot are constant along some simple line: obviously, all program runs with the same energy lie on a horizontal line (black), and all runs with the same performance lie on a vertical (blue), but also all runs with the same energy-delay product (EDP) lie on a straight line through the origin (orange), the slope of the line being proportional to the EDP. Finally, all runs with the same power dissipation lie on a hyperbola (red). If we change something, such as the number of active cores per chip or the clock speed, or if we optimize or otherwise change the code, it is insightful to see how different metrics change as we move through the Z-plot. As a first example we study the behavior of a scalable code on a multi-core CPU socket.

Scalable performance vs. active cores

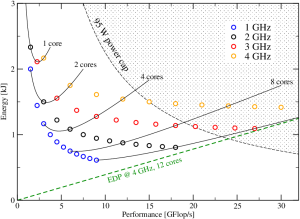
Figure 2: A scalable program in the Z-plot. Each circle represents a run at a certain clock speed (color coded) and a given number of cores. The solid lines interpolate between points with the same number of cores, i.e., the clock speed changes continuously along the line.

Figure 2: A scalable program in the Z-plot. Each circle represents a run at a certain clock speed (color coded) and a given number of cores. The solid lines interpolate between points with the same number of cores, i.e., the clock speed changes continuously along the line.

A good definition of “scalable” in a multicore context is “performance is linear in the number of active cores n.” Usually such programs also scale linearly in the clock speed f; the performance can thus be described by P(n,f)=nP_0f/f_0~~,where f_0 is some base or reference clock speed. If we run such a code on a multicore CPU, varying the number of cores and the clock speed, we may get data as shown in Figure 2. Some important observations strike the eye:

  • The more cores we use at a given clock speed (same-color data points from left to right), the lower the energy to solution.
  • Increasing the clock speed at constant number of cores seems to always increase the energy for large core counts, but for smaller core count there appears to be an optimal clock speed at which energy is at a minimum. This optimal frequency goes up as the number of cores goes down. E.g., it is around 3 GHz at one core but below 2 GHz at four cores.
  • The energy-delay product (EDP) goes down as the frequency goes up at fixed core count. In our example it is lowest at 12 cores and 4 GHz (green dashed line).

The data in Figure 2 does not come from measurements; it was constructed from the combination of our “scalable performance” model above with a multi-core power model, which was introduced in [1]. In a follow-up post I will show some measurements on real systems. In [2] we have applied the model to a lattice-Boltzmann (LBM) solver, but LBM is non-scalable across cores, which requires special treatment. Stay tuned.

[1] G. Hager, J. Treibig, J. Habich, and G. Wellein: Exploring performance and power properties of modern multicore chips via simple machine models. Concurrency and Computation: Practice and Experience, DOI: 10.1002/cpe.3180 (2014). Preprint: arXiv:1208.2908

[2] M. Wittmann, G. Hager, T. Zeiser, J. Treibig, and G. Wellein: Chip-level and multi-node analysis of energy-optimized lattice-Boltzmann CFD simulations. Concurrency and Computation: Practice and Experience, DOI: 10.1002/cpe.3489 (2015). Preprint: arXiv:1304.7664


WPMVP 2016: 3rd Workshop on Programming Models for SIMD/Vector Processing

Single Instruction Multiple Data (SIMD) parallelism is a major factor in the arithmetic peak performance of modern CPUs, but there is no “silver bullet” for leveraging it in the optimal way for improved application performance. Jan Eitzinger (formerly Treibig) of LIKWID fame is organizing the 3rd workshop on programming models for SIMD/vector processing, co-located with PPoPP 2016 in Barcelona, Spain. The first two workshops in this series in 2014 and 2015 brought together an interesting mix of developers and vendors, sparking lively discussions. This time the workshop proceedings will again be published in the ACM digital library. For more details please take a look at the WPMVP 2016 website.

Important dates:

  • Fri 13 Nov 2015: Paper submission deadline
  • Mon 14 Dec 2015: Notification of acceptance

Fooling the masses – Stunt 16: Worship the God of Automation!

(See the prelude for some general information on what this is all about)

Developing a true understanding of a problem by thorough analysis is so 19th century. When there were no computers, people had to actually sit down with paper and pencil (quill?) and use their brains to figure out stuff. How old-fashioned and boring.

Automation.png

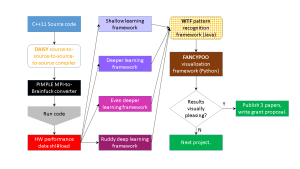
Figure 1: In automation, plugging one framework into the next is pivotal. Why not reuse what you already have?

With the advent of computer science we have added substantial momentum to automation. And it’s not just about automating tedious computations, but also about day-to-day tasks such as filtering information, visualizing data, and (now imagine a heroic fanfare in the background) the process of thinking itself!  With automation we don’t have to care about the validity, usefulness, or tenability of our automatically generated results, because understanding or insight was not asked for. The point is that “stuff” drops out of some program. What else could we wish for?

In high performance computing we find a particularly strong case for automation. Parallel computers are so complicated. Code is complicated. Compilers are complicated. The way performance is composed of all those little bottlenecks in the machine is complicated. So let’s design a machine (i.e., a program) that takes all this intricacy and digests it. This usually means we have to produce and interpret lots of data, but computers are good at crunching data, too! So why not use a fancy data analysis framework to dig out the information? It’s all in the data, so the machine should be able to see through it.

This is all easier than one might think. Do what tool developers do all the time: Build a new meta-tool from all the analysis tools you can lay your hands on (see figure). Then take a bunch of source codes, feed them into your new tool, and draw a diagram that shows in fancy colors that L3 misses and long network latencies are correlated with low performance and high energy consumption. Et voilà: real science!

Of course there are those reactionary die-hards who are still fostering the brain-quill-and-paper approach. But this is the age of cybernation1! Steal their thunder by repeating the computer science mantra: “Can this be automated? This can be automated. Automate this!” (a little rocking back and forth with eyes closed will emphasize the religious dimensions of your message).

If they are still obstinate, throw random pieces of Haskell code at them. That should teach them a lesson.

1 I love the similarity between cybernation and hibernation. It’s cyberlarious.

Preview for SC15 tutorial on “Node-Level Performance Engineering” now available

SC15 solicits video previews of accepted tutorials for the first time this year. So watch the commercial for our SC15 full-day tutorial “Node-Level Performance Engineering“!

Kudos to Jörn Rüggeberg from the RRZE multimedia center for putting together this great piece of art.

ISC15 Workshop on “Performance Modeling:Methods and Applications”

This year’s International Supercomputer Conference (ISC15) in Frankfurt is going to host workshops for the first time. Luckily, our proposal was accepted so there will be a workshop on “Performance Modeling: Methods and Applications,” featuring many renowned experts on performance modeling techniques. Bill Gropp has agreed to present the keynote talk, and we aim at a broad overview of the field that should be suitable for an audience with a wide spread of prior knowledge. So if you plan to visit ISC, July 16 is the date! See the ISC15 Agenda Planner – Performance Modeling Workshop for more information.

Fooling the masses – Stunt 15: Play mysterious!

(See the prelude for some general information on what this is all about)

Do you know that feeling when you think to yourself “What on earth did they do there?” when reading a paper? After some depressing hours of trying to figure out how those guys got their results, you just give up, shrug, and cite them in your related work section because everybody else does. “My goodness” you think, “I wish I knew how to do this myself.” Here are some ideas.

Make it as hard as possible for others to figure out what you actually did, so that they can’t compare your results to theirs right away. A popular strategy is to present problem sizes, i.e., the “amount of work,” separately (on a different page) from performance results, which in turn should be given in seconds (time to solution). This will force your audience to figure out the conventional “work/time” performance metric by themselves; many will give up and just believe your statement that you are “faster than X.” It will also be harder to compare with performance models, which is a good thing if you’re off the model by some large factor. Runtime is not the only effective metric; anything unusual will do, such as “microflops per picosecond” or “cache misses per core hour.” Combine with stunt 12 as needed.

Test case problem size
# Iterations Runtime [s]
car see page 4 500  2.34521
plane see page 6 sufficient  3.14159
train see page 2 roughly 112  0.11991
chicken see page 12 whatever  42.0

It’s really useful to be secretive about the exact hardware you were using. “eight-core AMD Opteron” or “six-core Intel Xeon” will usually suffice as a description. You may throw in the clock speed for good measure, but don’t mention whether you have activated Turbo Mode or not, or whether you used one socket or two, or how you enforced affinity. On the other hand, never forget to specify the exact Linux distribution and kernel version! No performance paper will be complete without it. We don’t want to hide anything after all, right?

Talking about openness: leave a good impression by making your software framework available for download. But when you do, take care to make it impossible to actually run it. Forge a totally convoluted, mind-twisting build system. Put in dependencies to several huge Java frameworks with version numbers far into the past or the future (requiring gcc 2.95.2 will work fine, too!). Never write plain C code, always generate it, using popular languages such as Logo, Java2kWhitespace, or Brainfuck (pick any two). Because: what they can’t run, they can’t criticize! (Think “Stupida Mouse!”) Give your software framework a fancy, foreign-sounding name, preferably from a romance language. Acronyms are so 1980s1, but “Inocentada,” “Vanitas,” “Nebulosità,” or “Ordure” will really cut the mustard.

If your strategy works you can even afford to be bold in your abstract: “Our framework achieves up to 34% more performance than previous work.” Since nobody can refute that claim due to your bleeding-edge camouflage tactics, you have laid the foundation of what will be known in a few years as “seminal work.”


1 So I was told by Julian

Attendee survey results from the SC14 “Code Optimization War Stories” BoF

At SC14 in New Orleans we (Jan Treibig and I, with help by Thomas William from TU Dresden) conducted, for the first time, a BoF with the title “Code Optimization War Stories.” Its purpose was to share and discuss several interesting and (hopefully) surprising ventures in code optimization. Despite the fact that we were accused by an anonymous reviewer of using “sexist language” that was “off-putting and not welcoming” (the offending terms in our proposal being “man-hours” and “war stories”), the BoF sparked significant interest with some 60 attendees. In parallel to the talks and discussions, participants were asked to fill out a survey about several aspects of their daily work, which programming languages and programming models they use, how they approach program optimization, whether they use tools, etc. The results are now available after I have finally gotten around to typing in the answers given on the paper version; fortunately, more than half of the people went for the online version. Overall we had 29 responses. Download the condensed results here:  CodeOptimizationWarStories_SurveyResults.pdf

The results are, in my opinion, partly surprising and partly expected. Note that there is an inherent bias here since the audience was composed of people specifically interested in code optimization (according to the first survey question, they were mostly developers and domain scientists); believe it or not, such a a crowd is by no means a representative sample of all attendees of SC14, let alone the whole HPC community. The following observations should thus be taken with a grain of salt. Or two.


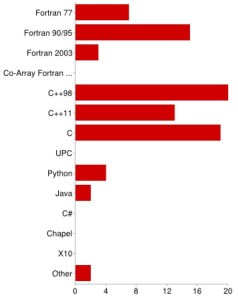
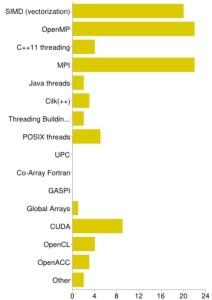
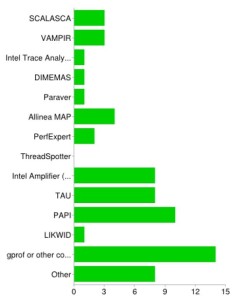
Management summary: In short, people mostly write OpenMP and MPI-parallel programs in C, C++, or Fortran. The awareness of SIMD is surprisingly strong, which is probably why single-core optimization is almost as popular as socket, node, or massively parallel tuning.  x86 is the dominant architecture, time to solution is the most important target metric, and hardly anyone cares about power dissipation. The most popular tools are the simple ones: gprof and friends mostly, supported by some hardware metrics. Among those, cache misses are still everybody’s darling. Among the few who use performance models at all, it’s almost exclusively Roofline.

lang.jpg

What is the programming language that you mostly deal with when optimizing code?

Here are the details:

  • Which area of science does the code typically come from that you work on? Physics leads the pack (59%)  here, followed by maths, CFD, and chemistry.
  • Programming languages. Fortran is far from dead: 52% answered “Fortran 90/95” when asked for the programming languages they typically deal with. Even Fortran 77 is still in the game with 24%. However, C++98 (69%) and C (66%) are clearly in the lead. For me it was a little surprising that C++11 almost matches Fortran at 45% already. However, this popularity is not caused by the new threading features (see next item).
  • Typical parallel programming models. Most people unsurprisingly answered “OpenMP” or “MPI” (both 76%). The unexpected (at least in my view) runner-up with 69% is SIMD, which is good since it finally seems to get the attention it deserves! CUDA landed at a respectable 31%, and C++11 threads trail behind at 14%, beaten even by the good old POSIX threads (17%). The PGAS pack (GASPI, Global Arrays, Co-Array Fortran, UPC) hits rock bottom, being less popular than Java threads and Cilk (7% and 10%, respectively). OpenCL struggles at a mere 14%. If it weren’t for this “grain of salt” thing (see above), one might be tempted to spot a few sinking ships here…
  • Do you optimize for single core, socket/node, or highly parallel? Code optimization efforts were almost unanimously reported to revolve around the highly parallel (69%) or socket/node level (76%), but 52% also care about single-core issues. The latter does not quite match the 69% who say they write SIMD-parallel code, which leaves some room for speculation. Anyway it is good to see that some people still don’t lose sight of the single core even in a highly parallel world.

    pmodels.jpg

    What is the parallel programming model that you mostly deal with when optimizing code?

  • Computer architectures. x86-based systems are clearly in the lead (90%) in terms of target architectures, because there’s hardly anything left. IBM Blue Gene (7%) and Cray MPPs (3%) came out very low, which is entirely expected: although big machines do get a lot of media attention, most people (have to) deal with the commodity stuff under their desks and in local computing centers. Xeon Phi (34%) and Nvidia GPUs (31%) go almost head to head; a clear success for Intel’s aggressive marketing strategy.
  • Typical optimization target metrics. This was a tricky one since many metrics overlap significantly, and it is not possible to use one and not touch the other. Still it is satisfying that low time to solution comes out first (72%), followed by speedup (59%) and high work/time ratio (52%). It would be interesting to analyze whether there is a correlation or an anti-correlation between these answers across the attendees; maybe I should have added “-O0” as another optimization option in the next question 😉 Low power and/or low energy, although being “pivotal today” (if you believe the umpteenth research paper on the subject) are just slightly above radar level. Probably there’s just not enough pressure from computing centers, or probably there weren’t enough attendees from countries where electric energy isn’t almost free, who knows?
  • Optimization strategies. No surprises here: 90% try to find a good choice of compiler options, and standard strategies like fixing load imbalance, doing loop transformations, making the compiler understand the code better, and optimizing communication patterns and volume, etc., are all quite popular. Autotuning methods mark the low end of the spectrum. It seems that the state-of-the-art autotuning frameworks haven’t made it into the mainstream yet.
  • Approaches for saving energy (or related). The very few people who actually did some energy-related optimization have understood that good performance is the lowest-order effect in getting good energy efficiency. Hardly anyone tried voltage and/or frequency scaling for saving energy. This may have to do with the fact that few centers allow users to play with these parameters, or provide well-defined user interfaces. Btw, since release 3.1.2 of the LIKWID tools we support likwid-setFrequencies, a simple program which allows you to set the CPU clock speed from the shell.
  • tools.jpg

    If you have used performance tools, which ones?

    Popular performance tools. 76% answered that they had used some tool for optimizing application code at least once. However, although optimizing highly parallel applications is quite popular (see above), the typical parallel tools such as Vampir or Scalasca are less fashionable than expected (both 10%, even behind Allinea MAP), and  TAU is only used by 28%. On the other hand, good old gprof or similar compiler-based facilities still seem to be very important (48%). There were some popular tools I hadn’t thought of (unforgivably) when putting together the survey, and they ended up in the “other” category: Linux perf, valgrind, HPC Toolkit. The whole picture shows that people do deal with single-thread/node issues a lot.  LIKWID deserves a little more attention, though 🙂

  • What are the performance tools used for? I put in “producing colorful graphs” as a fun option, but 21% actually selected it! Amazing, they must have read my “Show data! Plenty.” blog post. Joke aside, 76% and 66%, respectively, reported that they use tools for identifying bottlenecks and initial code assessment. Only very few employ tools for validating performance models, which is sad but will hopefully change in the future.
  • What are the most popular hardware performance events? Ahead even of clock cycles (31%) and Flops (41%), cache misses are the all-time winner with 55%. This is not unexpected, cache misses being the black plague of HPC and all. Again, somewhat surprisingly, SIMD-related metrics are strong with 28%. Hardly anyone looks at cross-NUMA domain traffic, and literally nobody uses hardware performance counters to study code balance (inverse computational intensity).
  • Do you use performance models in your optimization efforts? The previous two questions already gave a hint towards the outcome of this one:  41% answered “No,” 21% answered “Yes,” and 24% chose “What is this performance modeling stuff anyway?” Way to go.
  • Which performance model(s) do you use? Among those who do use performance models, Roofline is (expectedly) most popular by far, although there’s not much statistics with six voters.
  • The remaining questions have dealt with how useful it would be to have a dedicated “code optimization community” (whatever that means in practice), which received almost unanimous approval, and how attendees rated the BoF as a whole. 62% want to see more of this stuff in the future, which we interpret as encouraging. Two people even considered it the “best BoF ever.” So there.

As I wrote above, there is a strong bias in these answers, and the results are clearly not representative of the HPC community. But if we accept that those who attended the BoF are really interested in optimizing application code, the conclusion must be that recent developments in tools and models trickle into this community at a very slow rate.


SC14 Intel Parallel Universe Computing Challenge: The Squad fails in the semi-final

All good things must end. In a heroic battle the Gaussian Elimination Squad was beaten by the “Brilliant Dummies” from Seoul University. We were quite a bit ahead after the trivia round, but the coding challenge was a real neck-breaker. We couldn’t even find the spot where one should start leveraging parallelism, and we ended up with a disappointing speedup of just above 1.

The Squad congratulates the Korean team, it was a great fight! We hope to return next year to SC15 in Austin, Texas.


SC14 Parallel Universe Computing Challenge Match #1: The Squad smashes the “Invincible Buckeyes”

At 8pm Central Time today, the Gaussian Elimination Squad fought their first round of the Intel Parallel Universe Computing Challenge against the “Invincible Buckeyes,” representing the Ohio Supercomputing Center and Ohio State University, at the SC14 conference. I have to admit that I needed to look up “buckeye” in the dictionary, where I learned that “buckeye” is a tree (going by the scientific name “Aesculus“, also known as the “chestnut”) as well as a nickname for residents of the U.S. state of Ohio. Nice pun, but no match for the kick-ass, brilliancy-radiating nom de guerre of the German team!

Just as last year, this is a single-elimination tournament, with eight teams fighting one-on-one in seven matches. Each match consists of two parts. The first is a trivia round, with questions about computing, parallelism, the history of supercomputing, and the SC conference series. The faster you select the correct answer (out of four), the more points you collect. After the trivia we had a slight advantage, but there was no reason to be over-confident. In the second part, the coding challenge, we had ten minutes to parallelize and optimize a piece of code (that we hadn’t seen before, of course). In a team effort without equal we managed to get a mind-boggling 240x performance speedup compared to the original version on the Intel Xeon Phi! The Buckeyes were stuck at something like 6x. Hence, this round goes to The Squad, and we are eagerly looking forward to the semi-finals on Wednesday.